## Filter sample data to only one metric
reportingResults_filter <- reportingResults %>%
dplyr::filter(MetricID == "Analysis_kri0001")
reportingBounds_filter <- reportingBounds %>%
dplyr::filter(MetricID == "Analysis_kri0001")
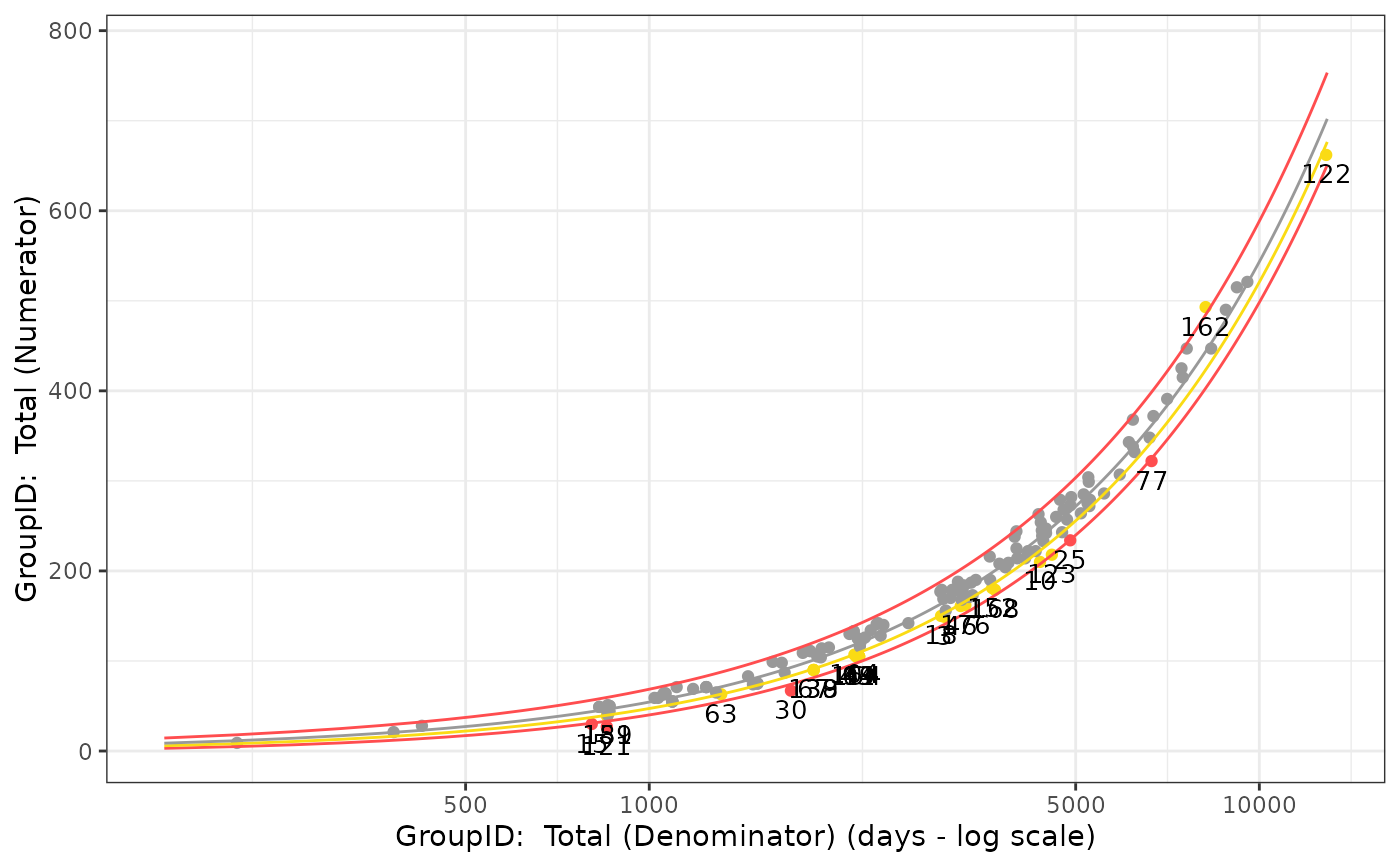
## Output- filtered to one snapshot date
Visualize_Scatter(
dfResults = reportingResults_filter %>%
dplyr::filter(SnapshotDate == max(SnapshotDate)),
dfBounds = reportingBounds_filter %>%
dplyr::filter(SnapshotDate == max(SnapshotDate))
)
#> Warning: Removed 253 rows containing missing values or values outside the scale range
#> (`geom_line()`).
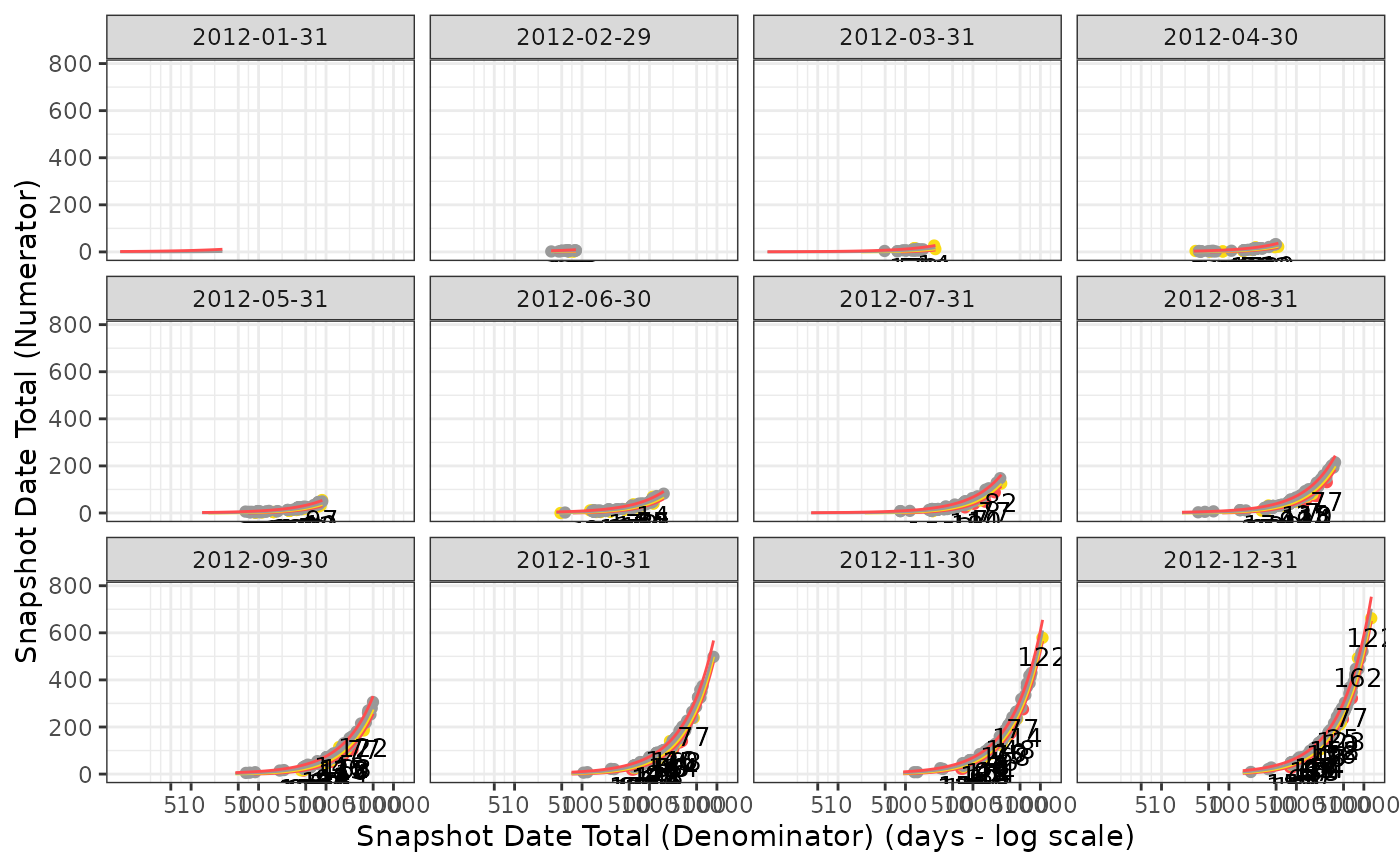
 ## Create Faceted output on snapshot date
Visualize_Scatter(
dfResults = reportingResults_filter,
dfBounds = reportingBounds_filter,
strGroupCol = "SnapshotDate",
strGroupLabel = "Snapshot Date"
)
#> Warning: Removed 253 rows containing missing values or values outside the scale range
#> (`geom_line()`).
## Create Faceted output on snapshot date
Visualize_Scatter(
dfResults = reportingResults_filter,
dfBounds = reportingBounds_filter,
strGroupCol = "SnapshotDate",
strGroupLabel = "Snapshot Date"
)
#> Warning: Removed 253 rows containing missing values or values outside the scale range
#> (`geom_line()`).
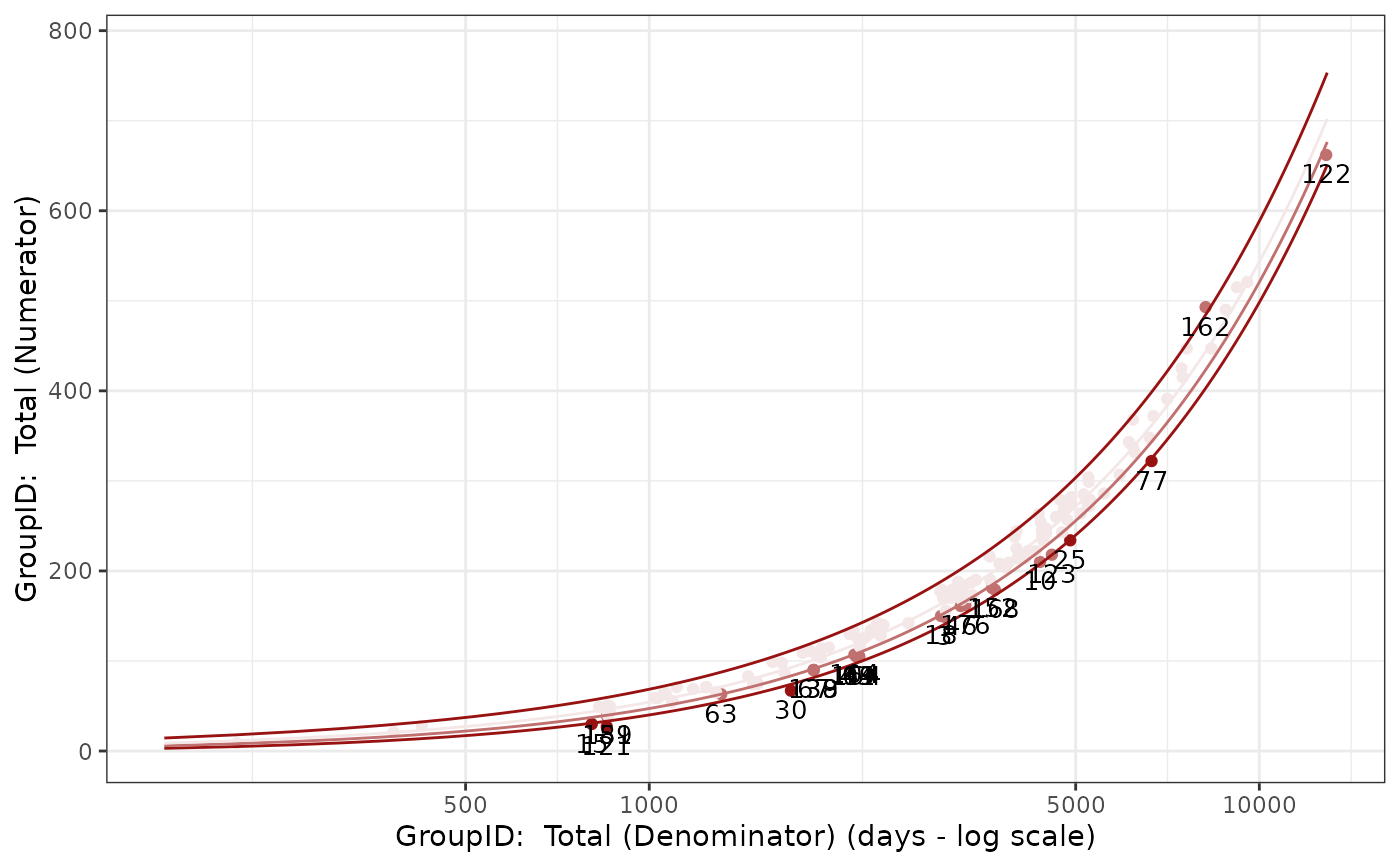
 ## Custom Colors
Visualize_Scatter(
dfResults = reportingResults_filter %>%
dplyr::filter(SnapshotDate == max(SnapshotDate)),
dfBounds = reportingBounds_filter %>%
dplyr::filter(SnapshotDate == max(SnapshotDate)),
vColors = c("#F4E7E7", "#C17070", "#981212")
)
#> Warning: Removed 253 rows containing missing values or values outside the scale range
#> (`geom_line()`).
## Custom Colors
Visualize_Scatter(
dfResults = reportingResults_filter %>%
dplyr::filter(SnapshotDate == max(SnapshotDate)),
dfBounds = reportingBounds_filter %>%
dplyr::filter(SnapshotDate == max(SnapshotDate)),
vColors = c("#F4E7E7", "#C17070", "#981212")
)
#> Warning: Removed 253 rows containing missing values or values outside the scale range
#> (`geom_line()`).
![[Stable]](figures/lifecycle-stable.svg)