Overview
This vignette describes how site-level risk scores are calculated using Key Risk Indicators (KRIs), their associated flags, and predefined weights for those flags. The risk scoring framework provides a standardized, quantitative way to highlight sites with elevated risk.
Risk Indicators, Flags and Weights
Each KRI (e.g., Adverse Events, Serious Adverse Events, Protocol
Deviations) in the gsm framework is assigned a
flag as part of the standard
analysis workflow. Flags can also be associated with a
weight, which reflects their contribution to site risk. For
example, a site with a low adverse event rate could present more risk
than a site with a low query rate. While both KRIs could have the same
flag value (e.g. -2, representing low rates compared to
other sites) a higher weight could be assigned to the AE KRI
flag than the query rate KRI flag. Default flag weights for the 12
standard gsm are shown below.
| KRI | Low_Red | Low_Amber | High_Amber | High_Red |
|---|---|---|---|---|
| Adverse Event | 32 | 16 | 1 | 2 |
| Serious Adverse Event | 8 | 0 | 4 | 8 |
| Protocol Deviations | 8 | 4 | 8 | 16 |
| Important Protocol Deviations | 0 | 0 | 16 | 32 |
| Labs | 0 | 0 | 1 | 2 |
| Query Rate | 0 | 0 | 1 | 2 |
| Delayed Query Rate | 0 | 0 | 1 | 2 |
| Delayed Data Entry Rate | 0 | 0 | 1 | 2 |
| Data Change Rate | 0 | 0 | 1 | 2 |
| Screen Failure | 0 | 0 | 8 | 16 |
| Treatment Discontinuation | 0 | 0 | 16 | 32 |
| Study Discontinuation | 0 | 0 | 16 | 32 |
The gsm.core::flag() function is used to calculate
site-level flag values and associated weights. Three key parameters are
used in the site-risk score process:
-
vThresholdVector of numeric values representing threshold values. Default isc(-3,-2,2,3)which is typical for z-scores. -
vFlagVector of flag values. There must be one more item in Flag than thresholds - that islength(vThreshold)+1 == length(vFlagValues). Default isc(-2,-1,0,1,2), which is typical for z-scores. -
vRiskScoreWeightVector of weights to apply to each flag value. Default:NULL.
When vRiskScoreWeight is provided, the
Flag() output will include additional columns capturing
Weight and MaxWeight with the corresponding
weight for each KRI.
These parameters allow for flexible configuration of the relative
risk for different metrics in a study. While single metrics can be run
via direct calls to Flag(), YAML
workflows are recommended for reusable implementations. As such, all
standard KRIs include default thresholds, flags and weights. For
reference, the relevant sections of the Adverse
Event KRI YAML, including the default flag and weight values and
Flag() function call are shown below for reference:
meta:
  Type: Analysis
  ID: kri0001
  GroupLevel: Site
  Abbreviation: AE
  Metric: Adverse Event Rate
  Numerator: Adverse Events
  Denominator: Days on Study
  Model: Normal Approximation
  Score: Adjusted Z-Score
  AnalysisType: rate
  Threshold: -2,-1,2,3
  Flag: "-2,-1,0,1,2"
  RiskScoreWeight: "32,16,0,1,2"
  ...
steps:
  - output: vThreshold
    name: gsm.core::ParseThreshold
    params:
      strThreshold: Threshold
  - output: vRiskScoreWeight
    name: gsm.core::ParseThreshold
    params:
      strThreshold: RiskScoreWeight
      bSort: false
  - output: vFlag
    name: gsm.core::ParseThreshold
    params:
      strThreshold: Flag
      bSort: false
  ...
  - output: Analysis_Flagged
    name: gsm.core::Flag
    params:
      dfAnalyzed: Analysis_Analyzed
      vThreshold: vThreshold
      vFlag: vFlag
      vRiskScoreWeight: vRiskScoreWeight
      nAccrualThreshold: AccrualThreshold
      strAccrualMetric: AccrualMetric
  ...
First, Threshold, Flag, and
RiskScoreWeight values provided in the metadata are parsed
from strings to vectors using gsm.core::ParseThreshold().
These parsed vectors are then passed to the
gsm.core::Flag() function to compute flags and weights for
each site.
Site Risk Score Calculation
Once all flags and weights for all metrics are calculated, a site risk score is calculated by taking the sum of the weights associated for each KRI. Below is a worked example for one site:
| KRI | Flag | Contribution |
|---|---|---|
| Adverse Event | -2 | 32 |
| Serious Adverse Event | 0 | 0 |
| Protocol Deviations | -1 | 4 |
| Important Protocol Deviations | 0 | 0 |
| Labs | 0 | 0 |
| Query Rate | 1 | 1 |
| Delayed Query Rate | 0 | 0 |
| Delayed Data Entry Rate | 0 | 0 |
| Data Change Rate | 0 | 0 |
| Screen Failure | 1 | 8 |
| Treatment Discontinuation | 0 | 0 |
| Study Discontinuation | 0 | 0 |
These weights are added up at the site level and divided by the maximum possible score to create a normalized risk score between 0 and 100. This normalized site risk score is what is reported in the KRI report, and if desired, any sites above a certain threshold can be flagged for further review.
normalized_score <- (sum(site_example$Contribution)/178) * 100
normalized_score
#> [1] 25.2809
Using CalculateRiskScore()
The gsm.kri::CalculateRiskScore() function simplifies
the risk score calculation process. The function takes KRI results with
flag information and a weights table to compute normalized risk scores
automatically.
Basic Usage
library(gsm.core)
library(gsm.kri)
library(dplyr)

# Step 1: Prepare KRI results (filter to single study/snapshot)
dfResults <- gsm.core::reportingResults %>%
  filter(!grepl("srs0001", MetricID)) %>%
  FilterByLatestSnapshotDate()

# Step 2: Create weights table from metric metadata
dfWeights <- MakeWeights(gsm.core::reportingMetrics)

# Step 3: Calculate risk scores
dfRiskScore <- CalculateRiskScore(
  dfResults = dfResults,
  dfWeights = dfWeights,
  strMetricID = "Analysis_srs0001"
)
The MakeWeights() function parses the Flag
and RiskScoreWeight columns from the metrics metadata
(e.g., gsm.core::reportingMetrics) to create a weight
lookup table. This table contains one row per MetricID-Flag combination
with corresponding weights and maximum weights.
Default Workflow
The Site Risk Score is calculated automatically as part of the
standard KRI workflow using the srs0001.yaml workflow file
located in inst/workflow/2_metrics/. This workflow:
- Filters the list of analyzed KRIs to only include those with the “kri” pattern
- Stacks the flagged results from all KRIs into a single data frame
- Calls
CalculateRiskScore()to compute site risk scores - Returns the results as a new metric (
srs0001) using thegsm.kri::CalculateRiskScore()function - The standard KRI report produced by
Report_KRI()includes a column showing the normalized site risk score for each site for a single study.
Cross-Study Site Risk Scores
The Widget_CrossStudyRiskScore() function enables
visualization of site risk scores across multiple studies
simultaneously. This widget provides an interactive table that allows
users to:
- View aggregated risk score statistics across studies
- Compare site performance within and across studies
- Drill down into individual site details by clicking on summary rows
Cross-Study Implementation
The cross-study widget requires results data that includes the
Analysis_srs0001 metric along with individual KRI results.
The workflow typically involves:
- Data preparation: Combine results from multiple studies, ensuring each has calculated site risk scores
-
Summary generation: Use
SummarizeCrossStudy()to aggregate metrics across studies - Widget creation: Pass results, metrics, and groups metadata to create the interactive visualization
# Example: Create cross-study risk score widget
cross_study_widget <- Widget_CrossStudyRiskScore(
  dfResults = multi_study_results,  # Must include Analysis_srs0001
  dfMetrics = gsm.core::reportingMetrics,
  dfGroups = multi_study_groups,
  strGroupLevel = "Site"
)
The widget produces an interactive table showing risk score summaries across studies:
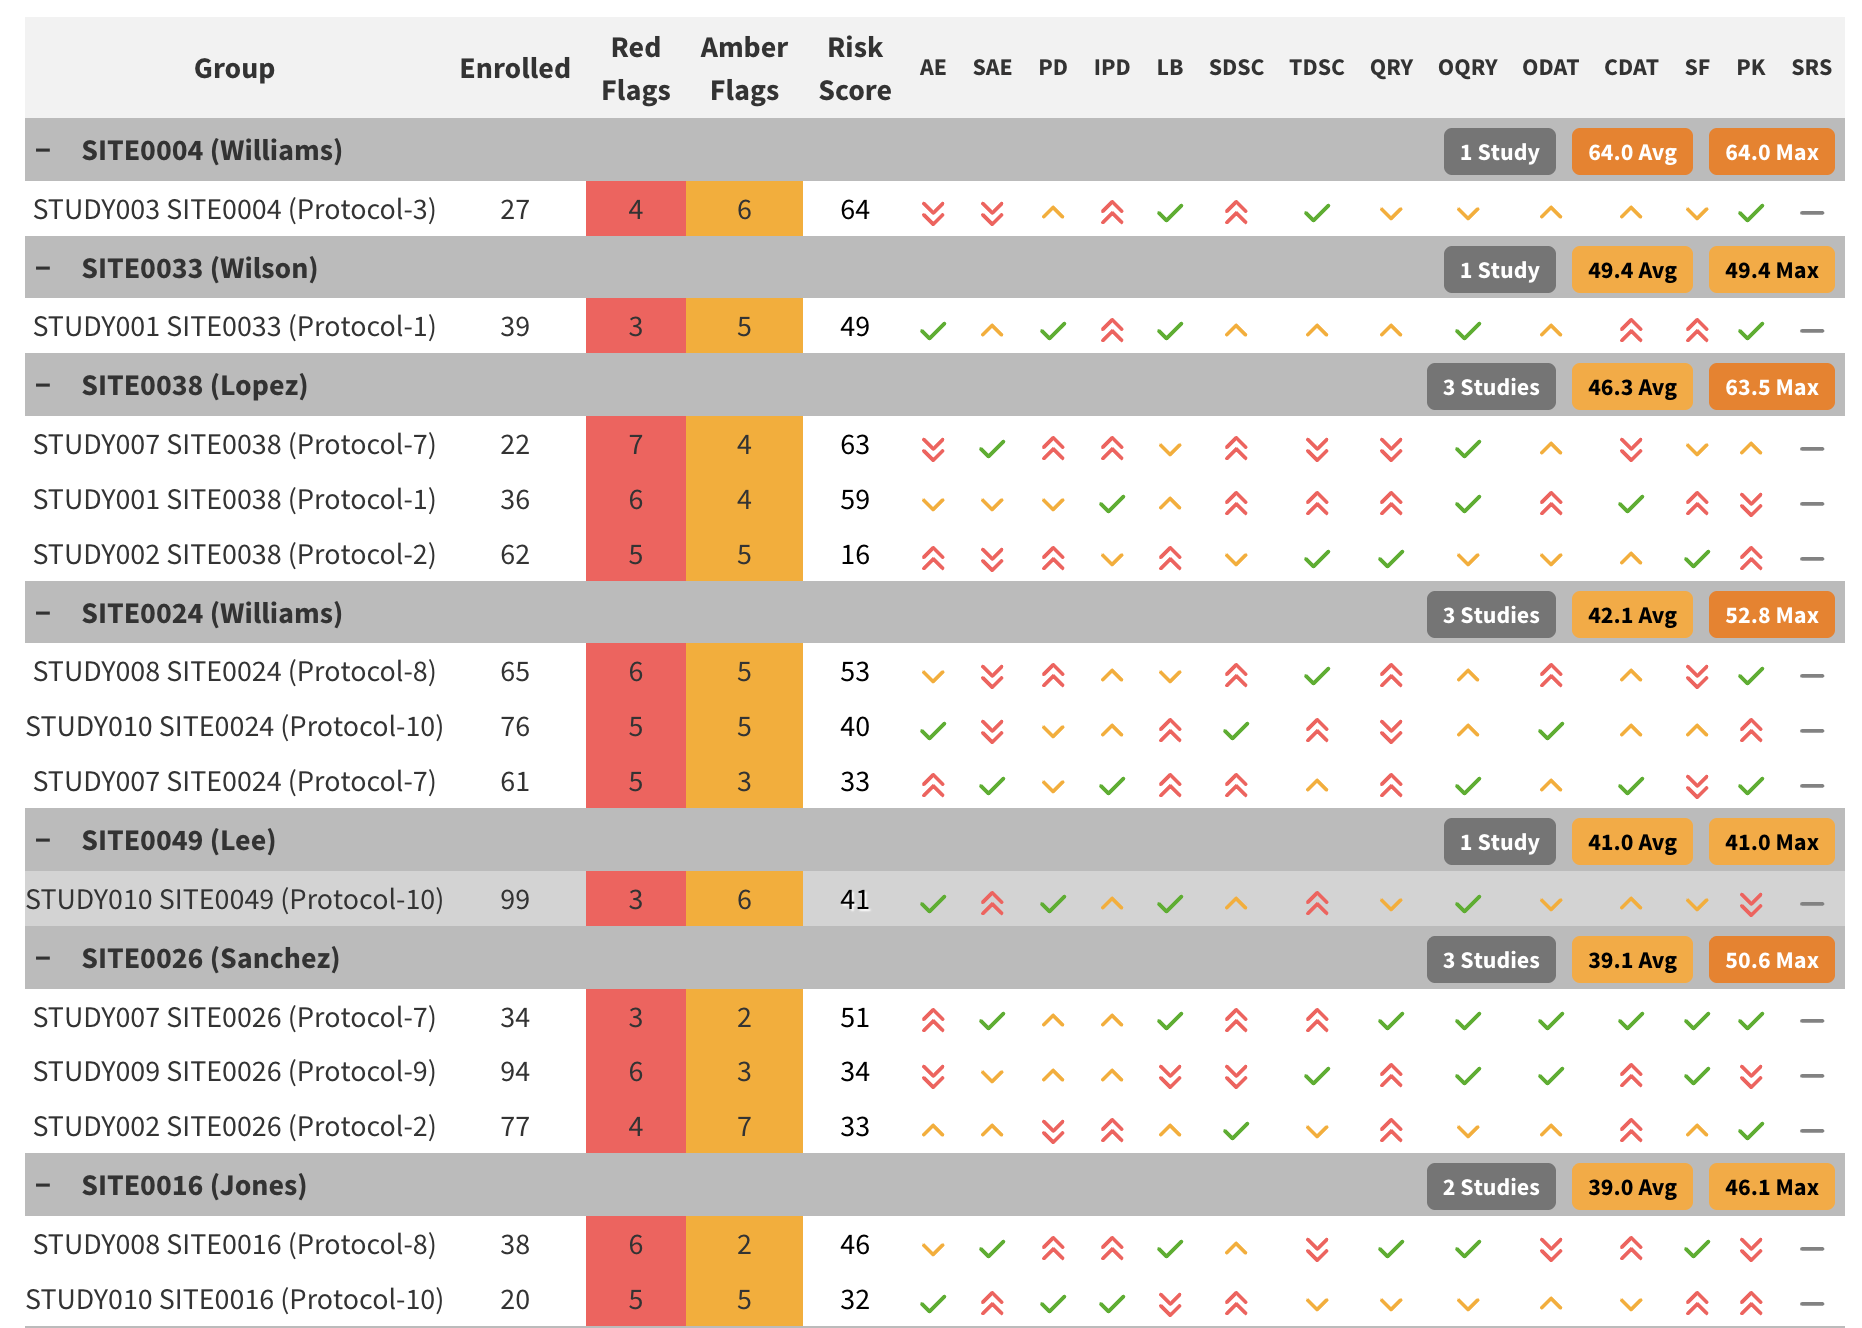
Cross-Study Risk Score Widget showing site risk summaries across multiple studies
For a complete working example, see https://github.com/Gilead-BioStats/gsm.kri/blob/main/pkgdown/menus/examples/Example_CrossStudySRS.Rmd, which demonstrates:
- Simulating multi-study data with site risk scores
- Creating the cross-study widget
- Rendering the interactive visualization in an HTML report
This functionality is particularly useful for portfolio-level monitoring where sponsors need to assess relative risk across multiple clinical trials simultaneously.