Description
Generate a shiny app that presents the input and output of {gsm.kri} in a way that allows clinical monitors (etc) to dive deeper and identify the sources of issues.
Features & Bug Fixes
Explore the screenshot evidence presented here to determine if you agree that the app does what is described. Click images for larger versions. If you agree that the app does what is described, go to the linked GitHub issue for that feature or bug fix, and comment with your approval. If you do not agree, go to the linked GitHub issue for that feature or bug fix, and comment with what you believe is incorrect.
520: Feature: The app always indicates the study with which it is associated.
By default, the app displays a title generated from the study information in dfGroups.

The app title can be customized at launch.

521: Feature: The user can filter the data.
If the data contains more than one group level (e.g., “Site” vs “Country”), a “Group Level” filter is displayed.


If the “Group Level” filter is displayed, the user can filter the data by group level.
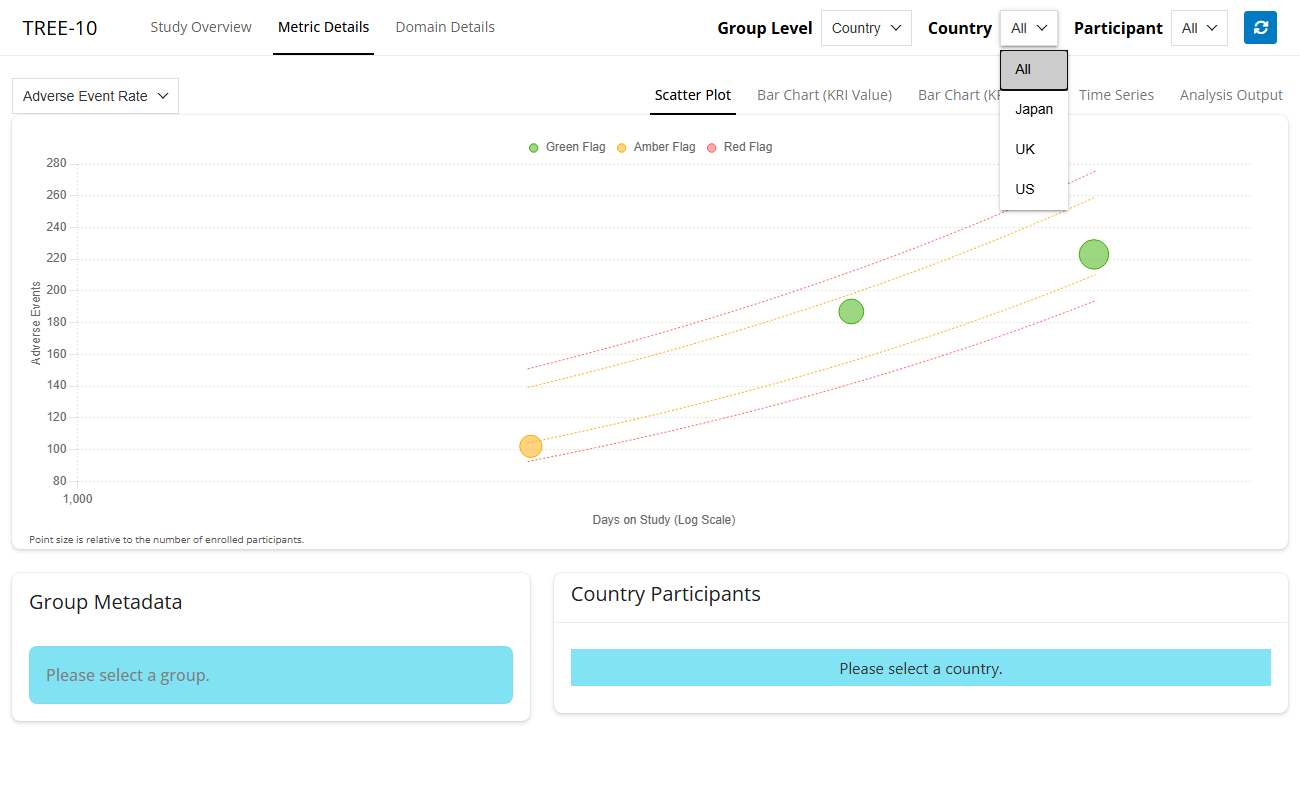
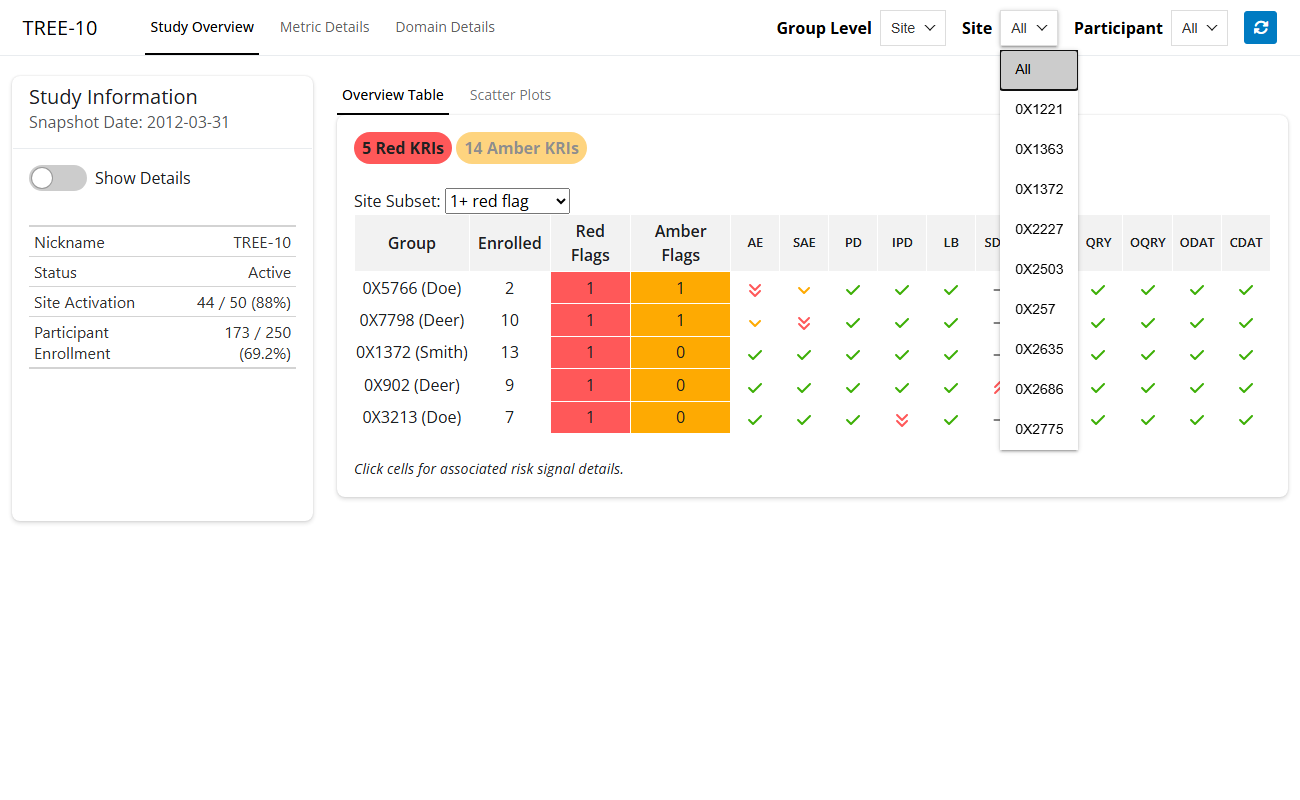
The user can filter the data by group (e.g., “Site” or “Country”) within the selected “Group Level”.
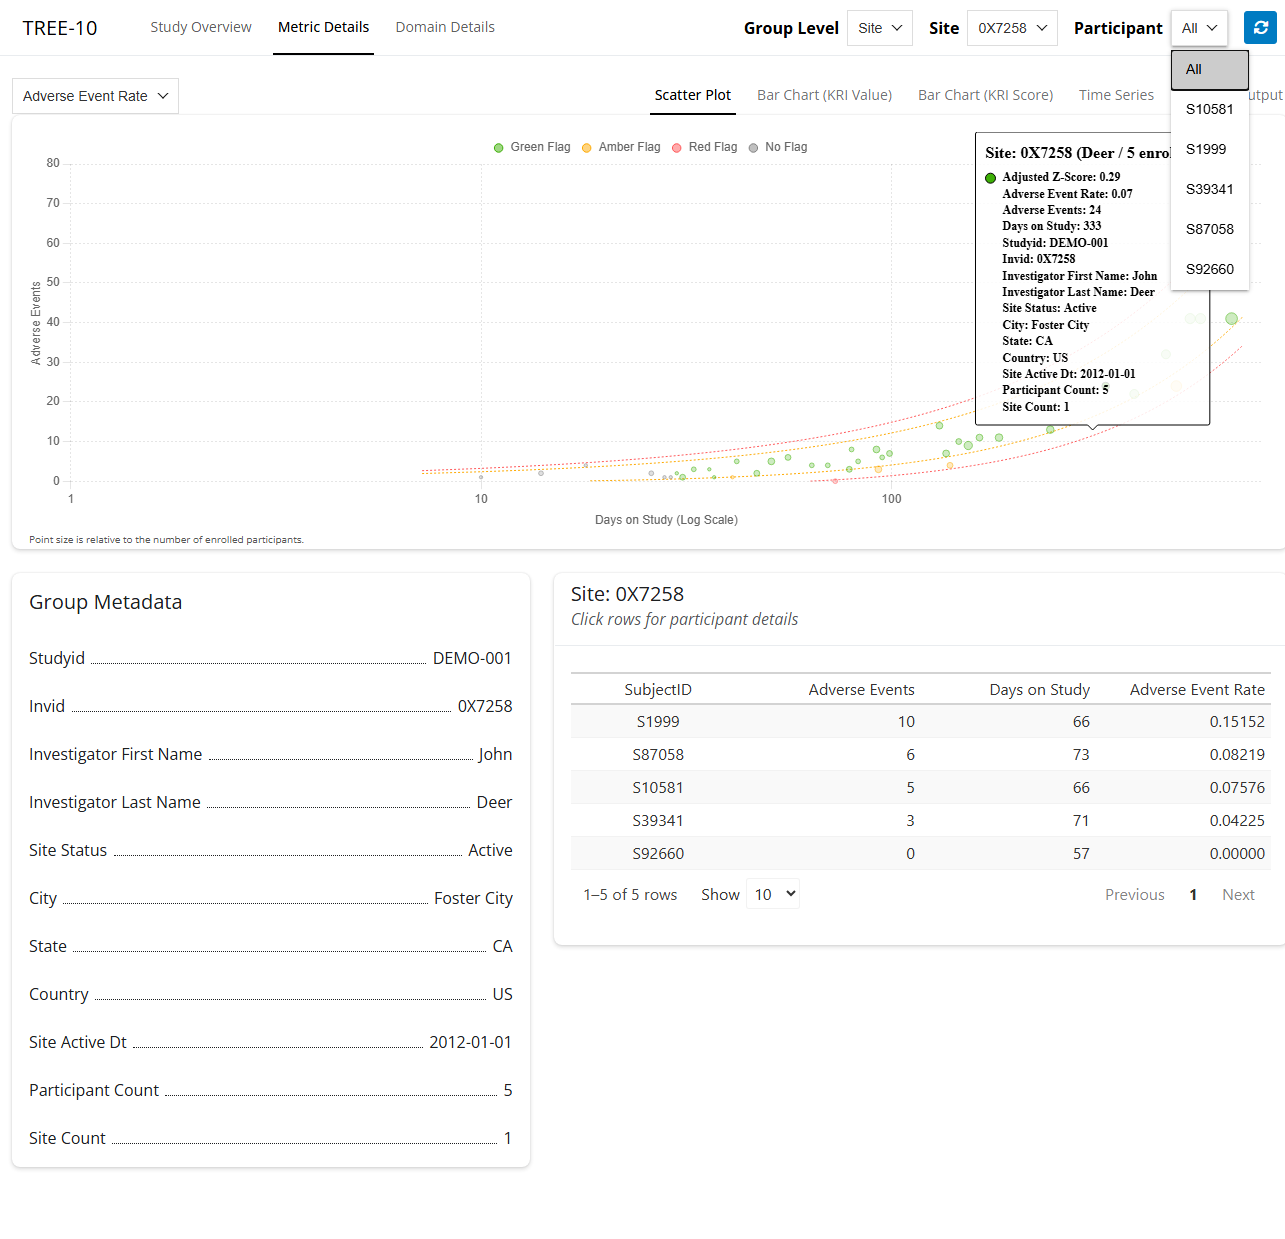
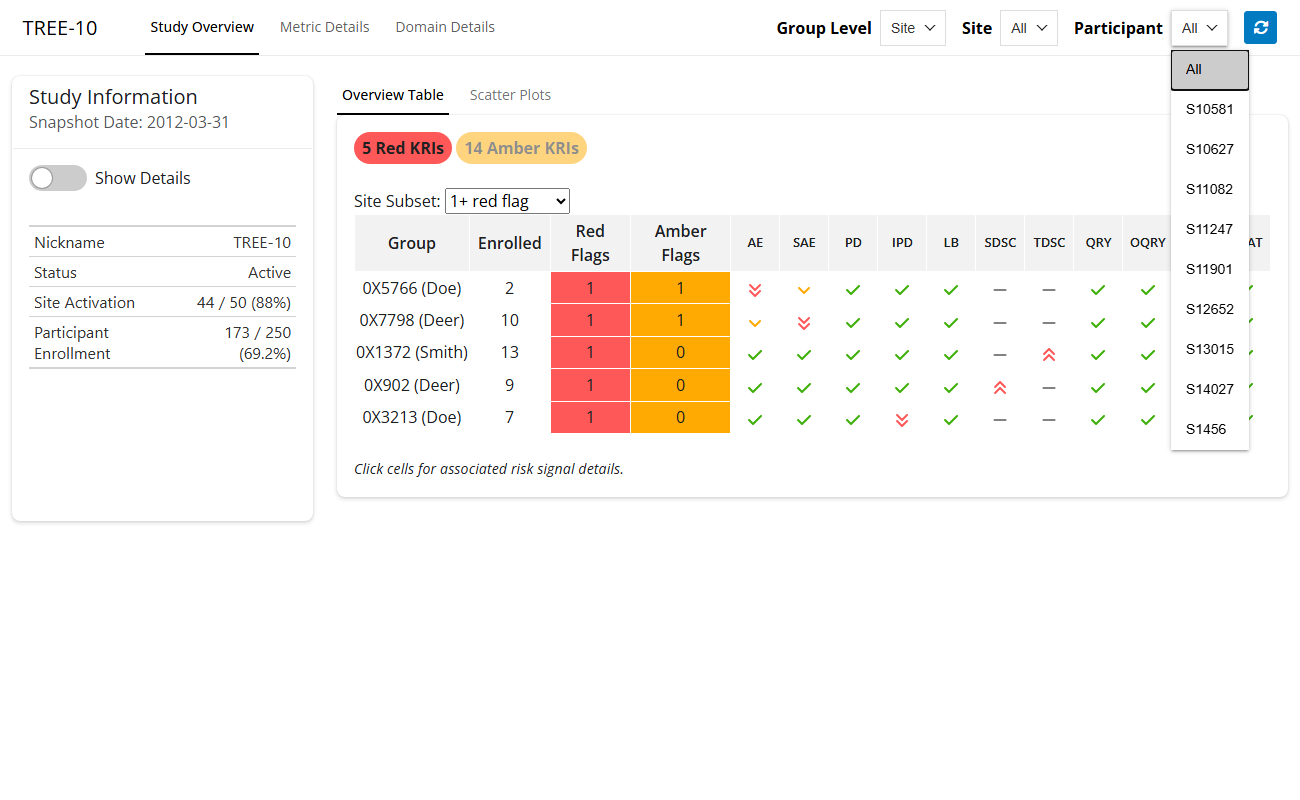
The user can filter the data by “Participant”.


The user can reset all filters to their default values.


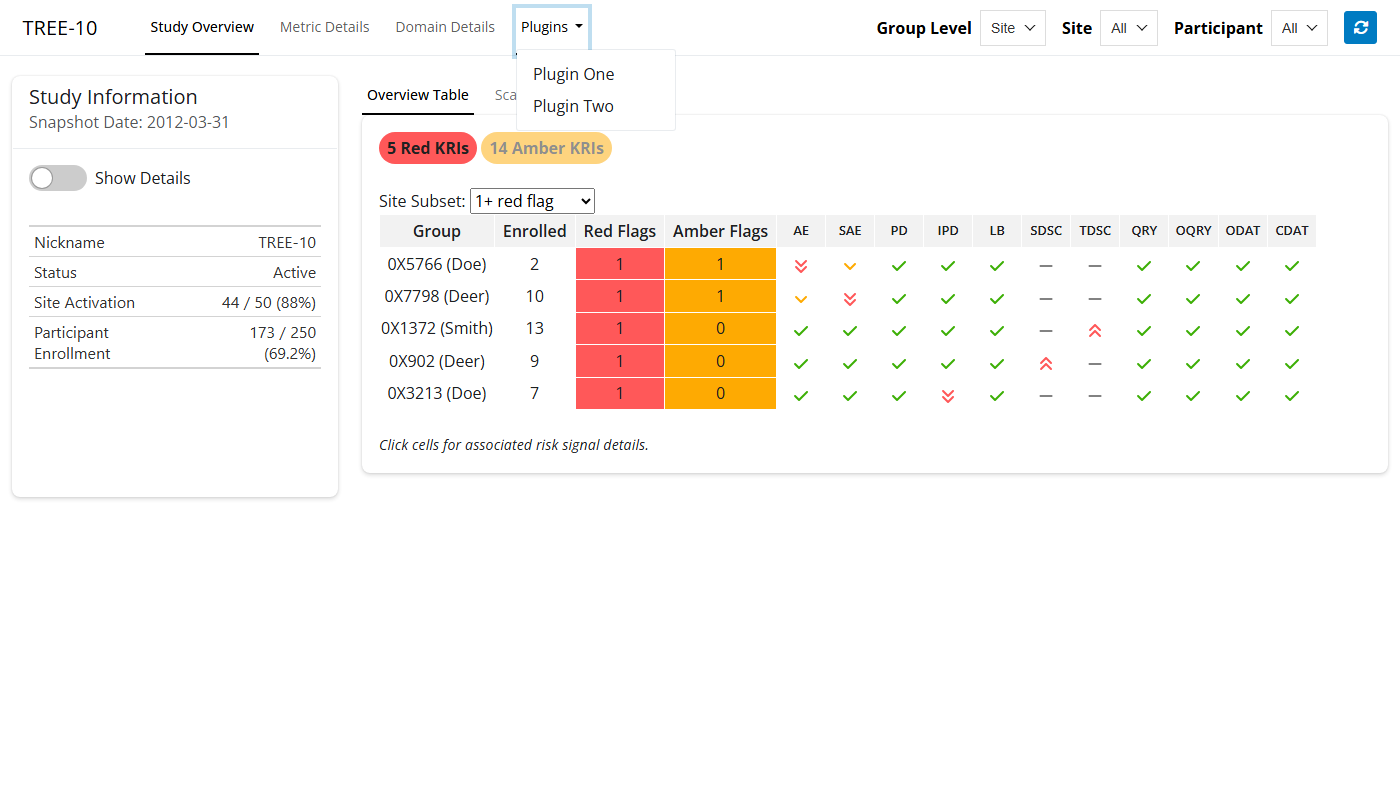
522: Feature: The user can drill down into views of different aspects of the data.
The user can navigate between the main sections of the app using a navigation bar at the top of the page.


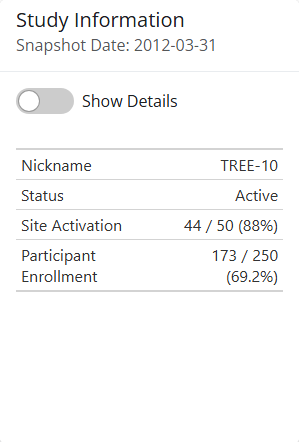
523: Feature: The user can view a card with a high-level overview of the study metadata.
The card is the validated card generated by gsm.kri::Report_StudyInfo().
524: Feature: The user can view an interactive KRI summary table.
The table is the validated group overview generated by gsm.kri::Widget_GroupOverview().

The KRI summary table is filtered to the selected “Group Level”.
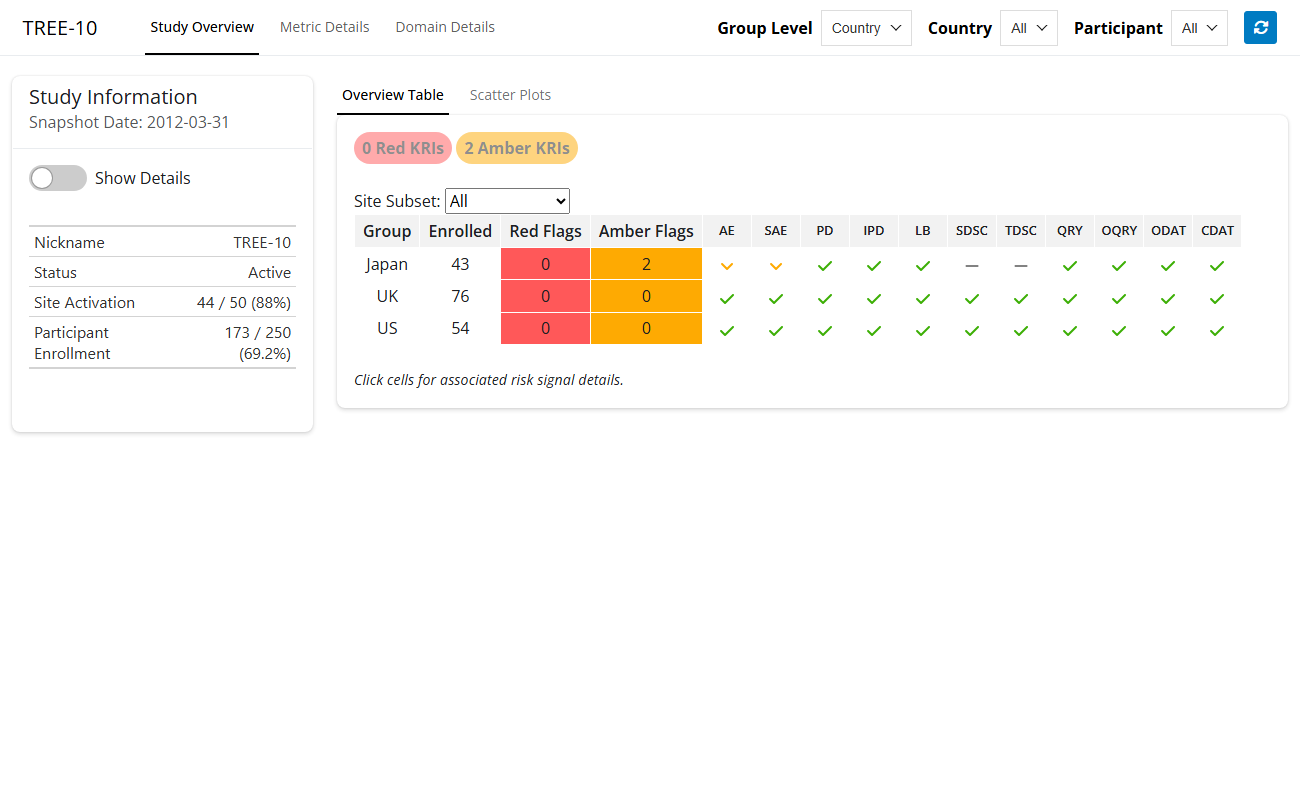
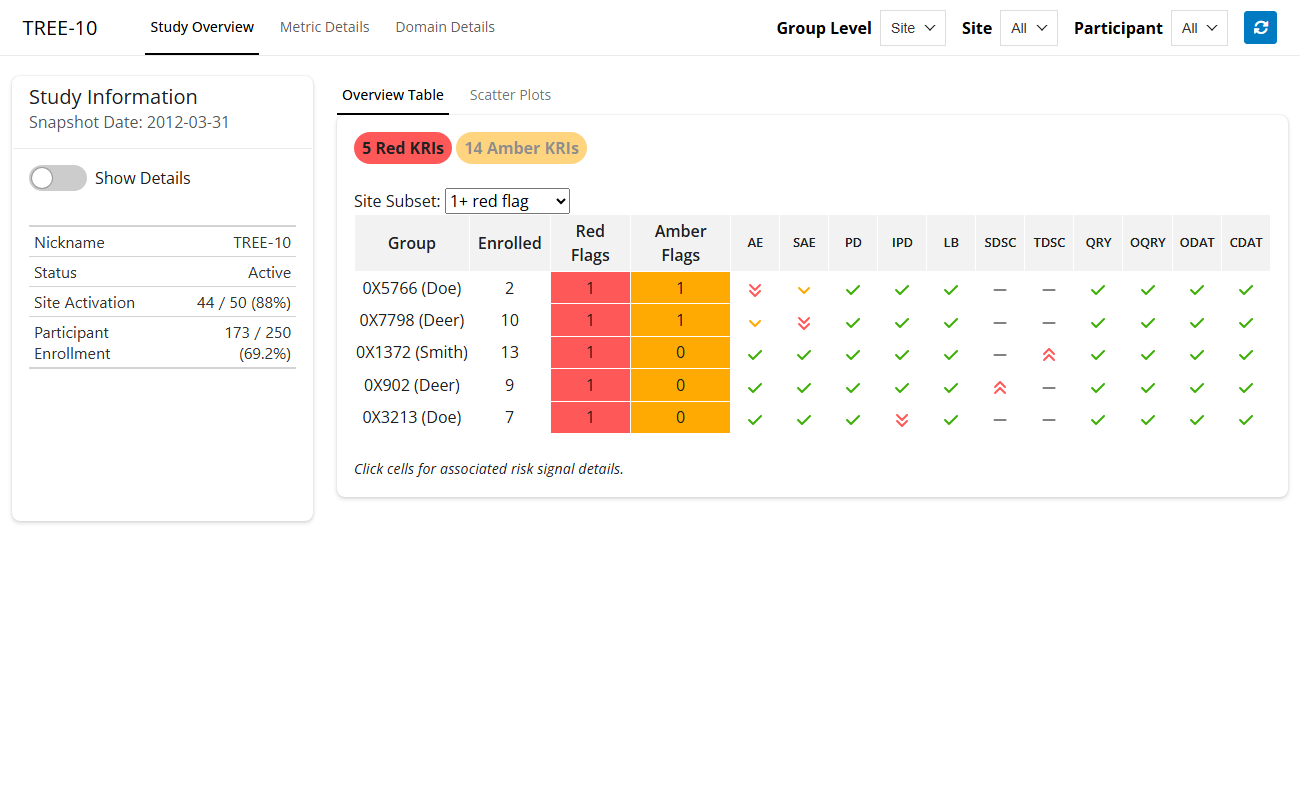
The user can filter the KRI summary table by flag status (red, amber, or both) using clickable pills.
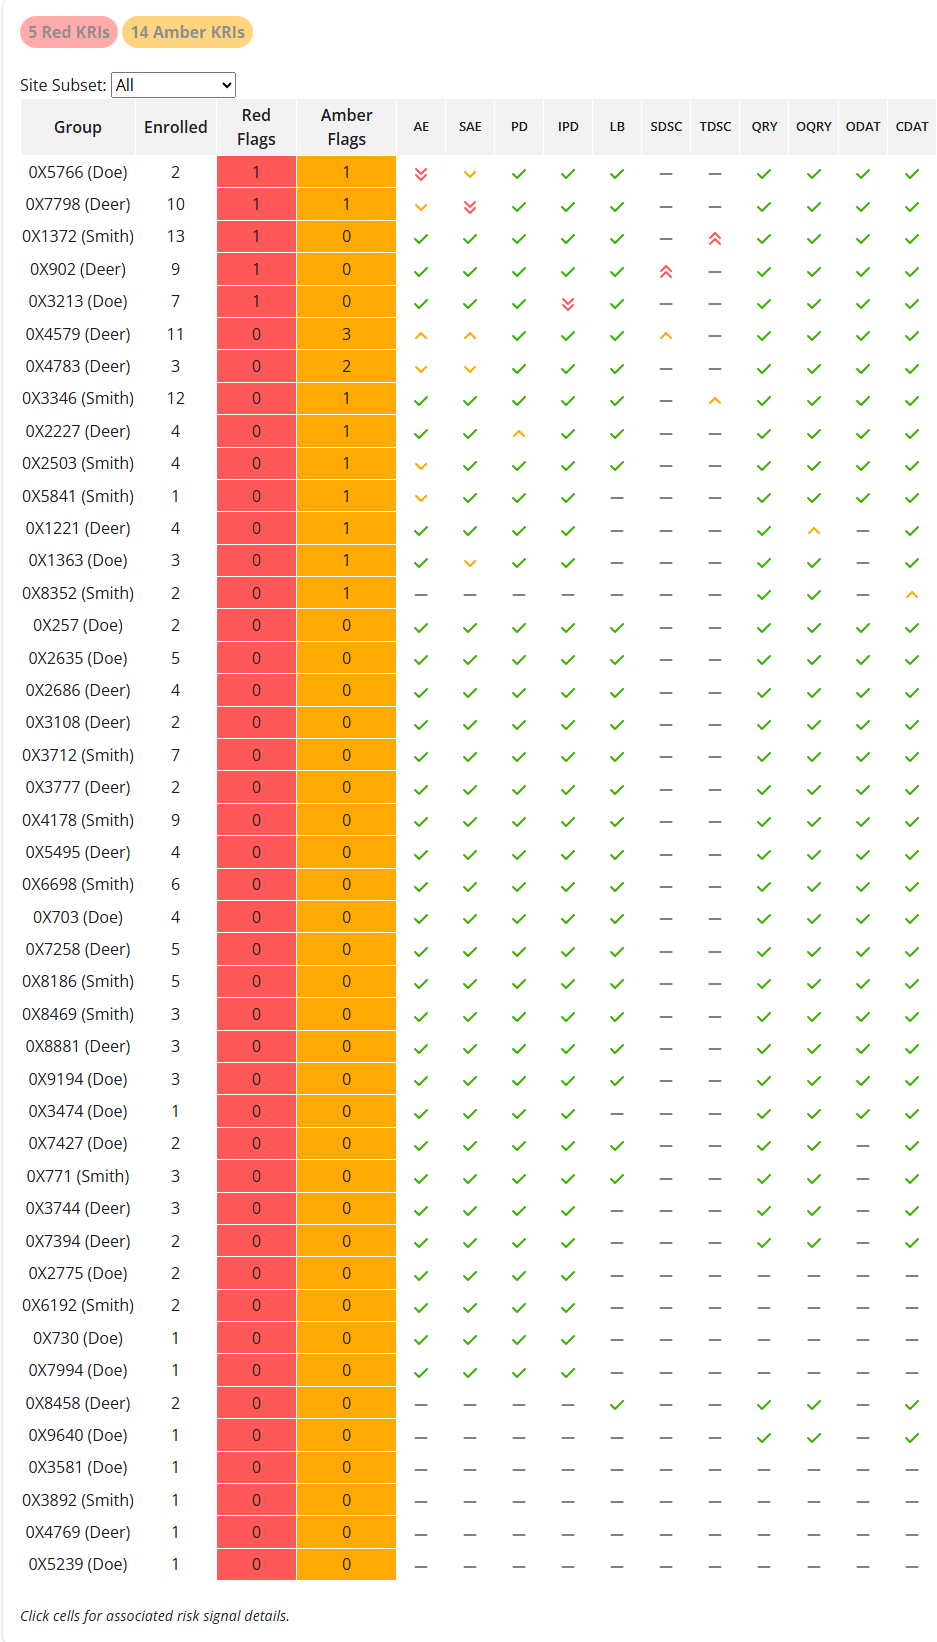
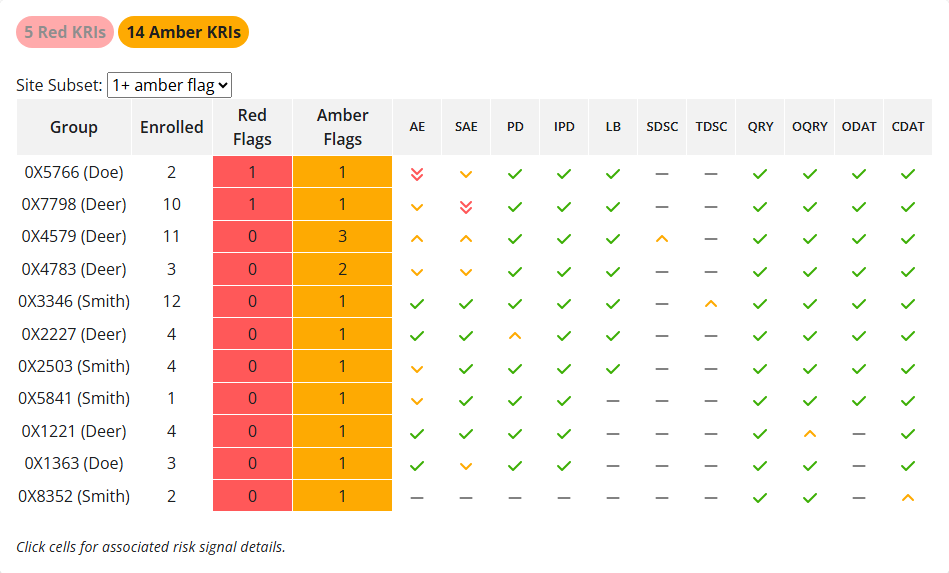
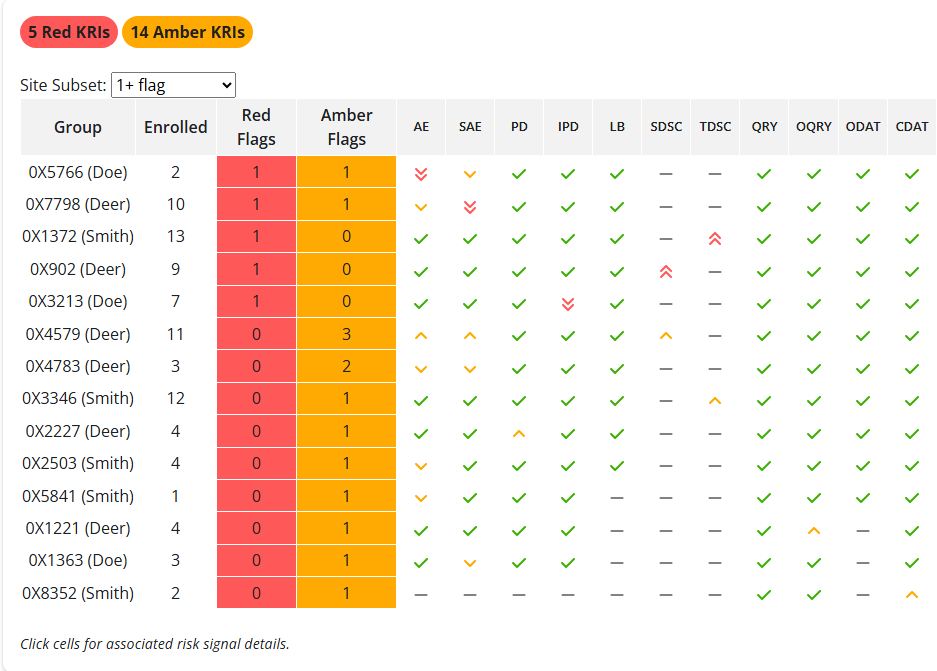
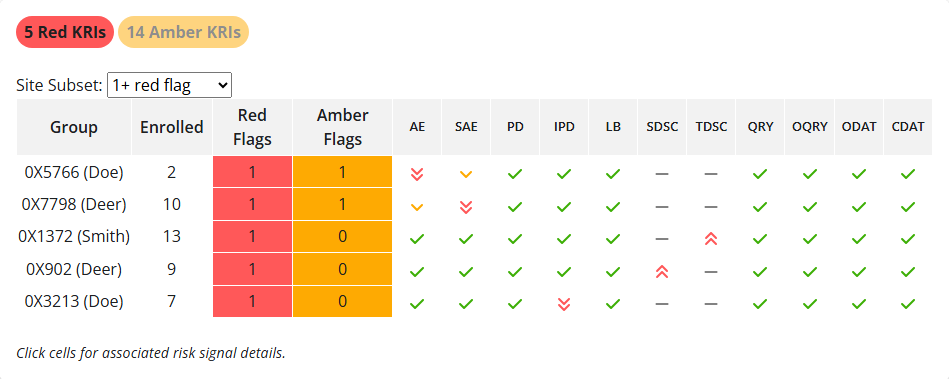
The flag status pills display a count of KRIs with that flag status for the selected “Group Level”.


Clicking a KRI cell in the summary table navigates the user to the “Metric Details” tab, filtered to that KRI and group.
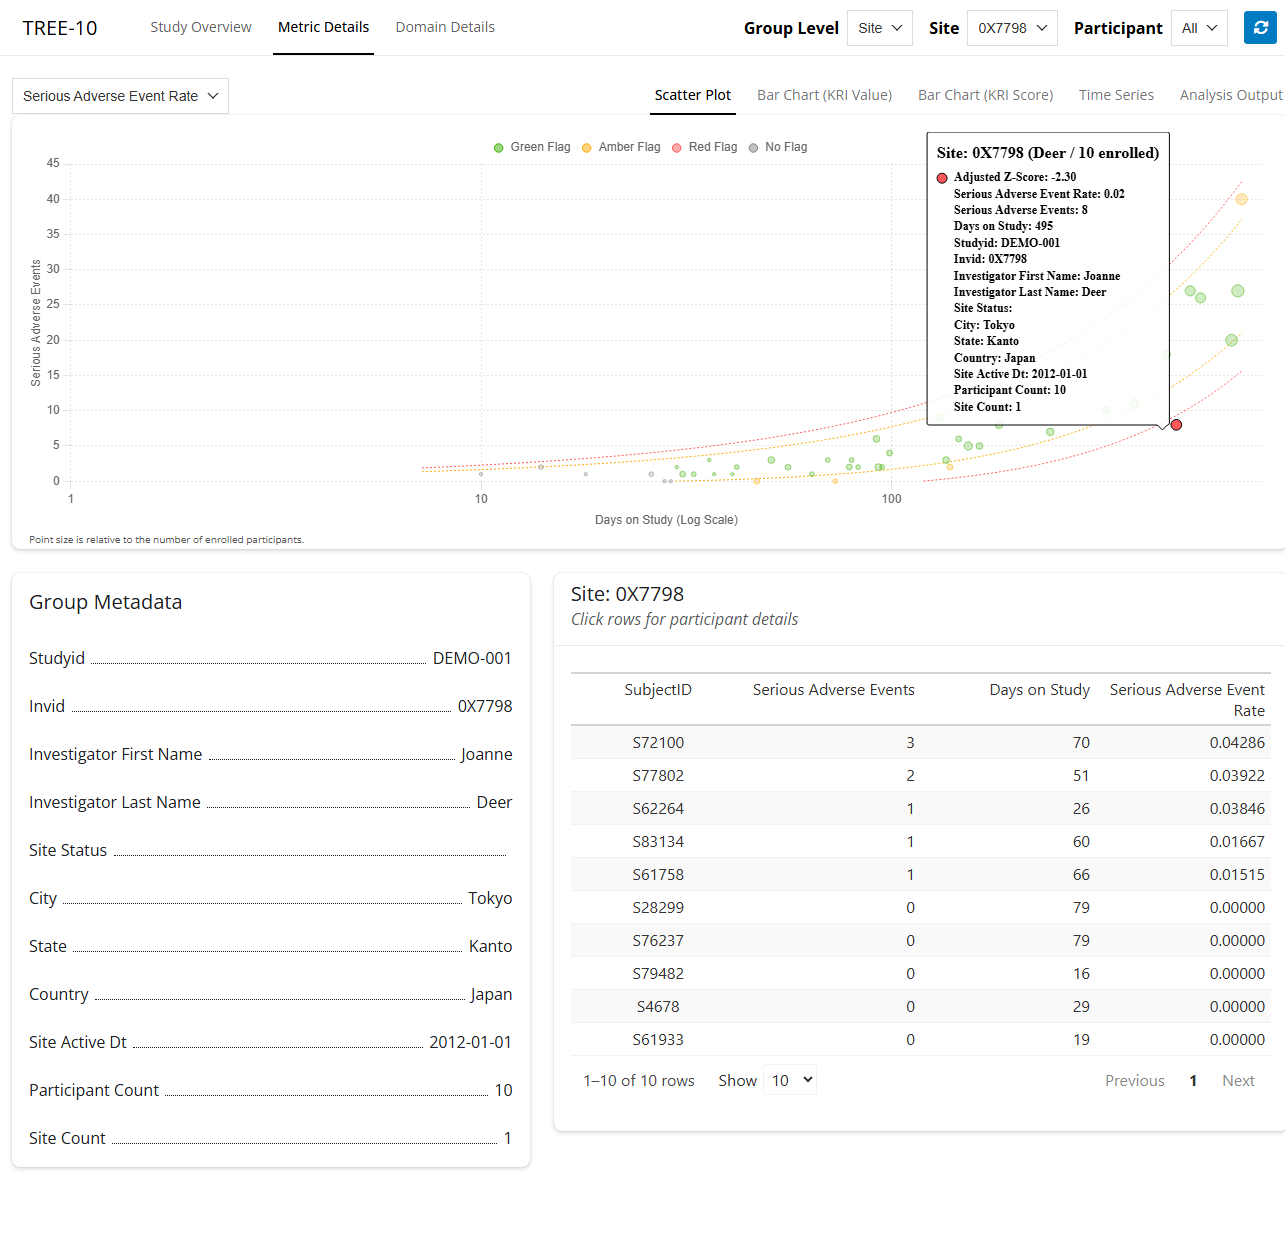
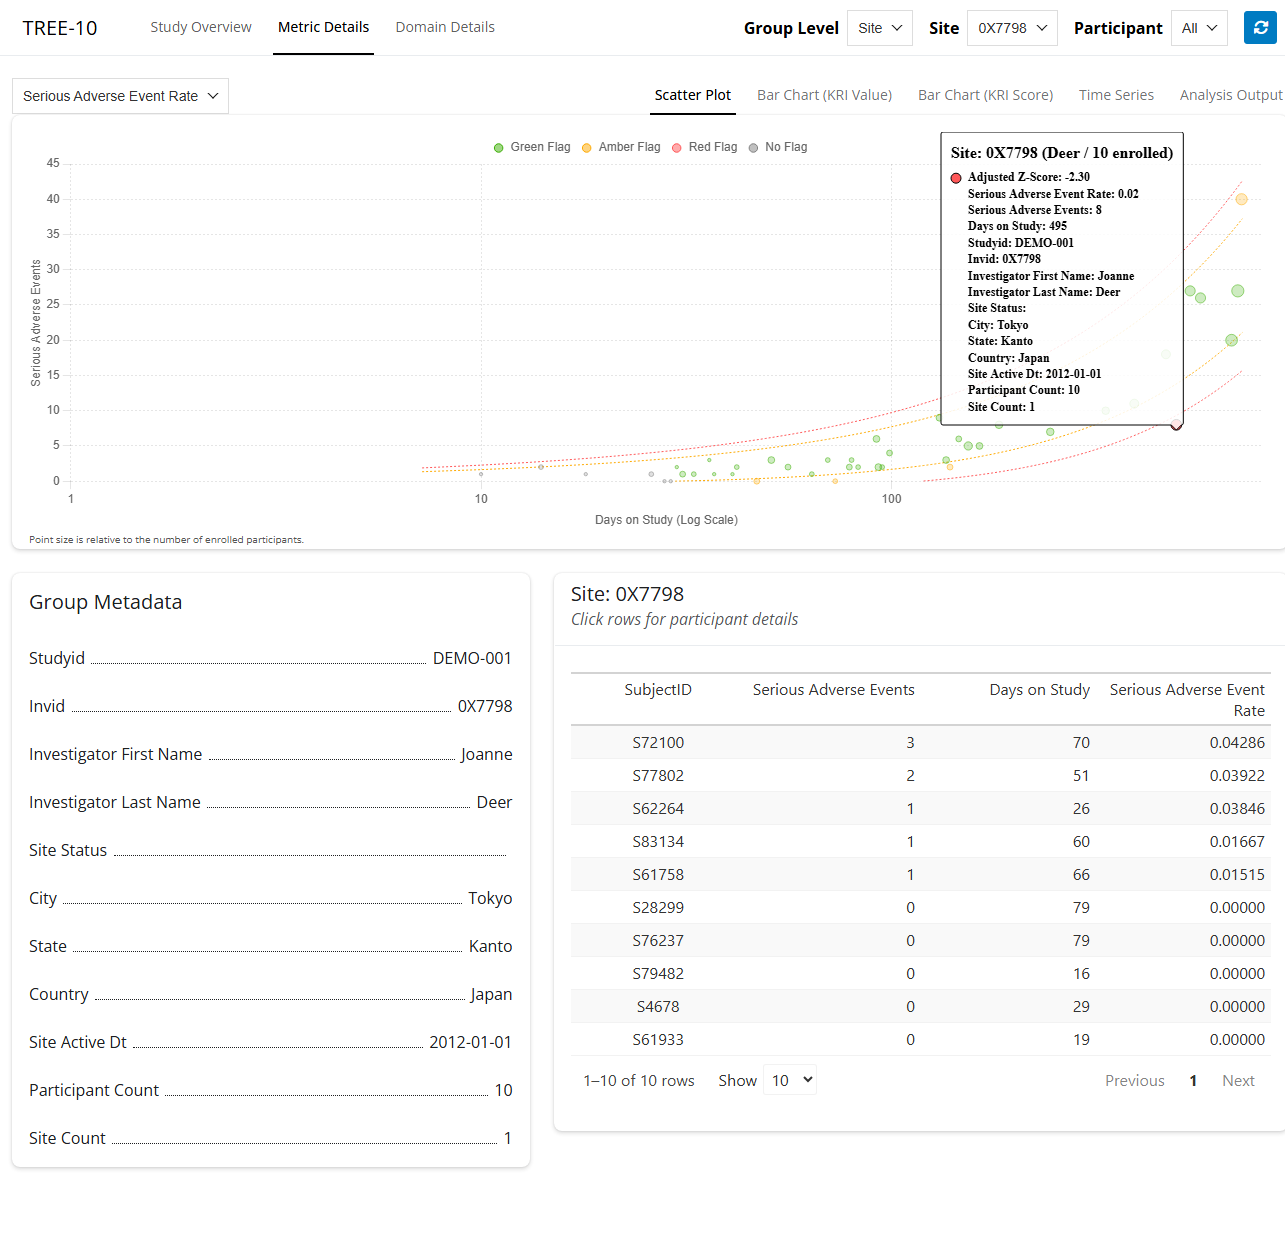
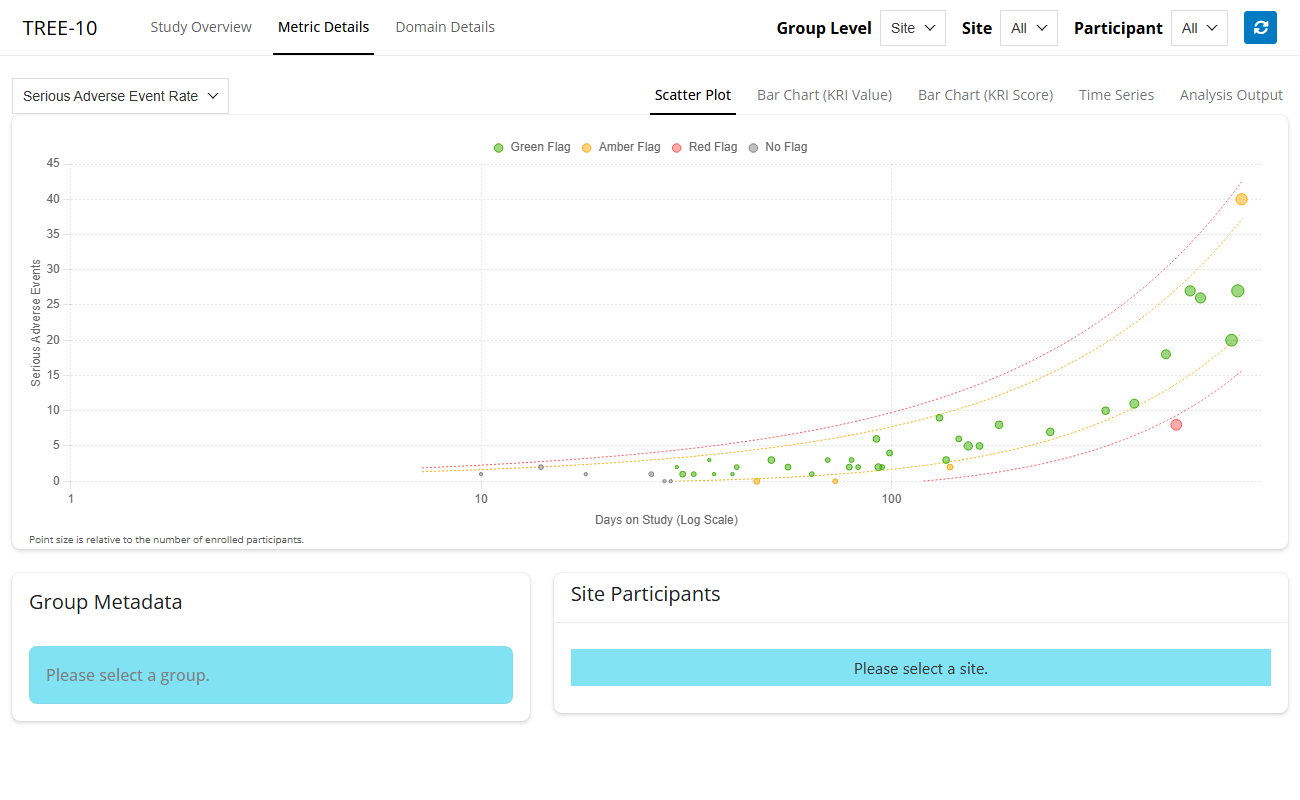
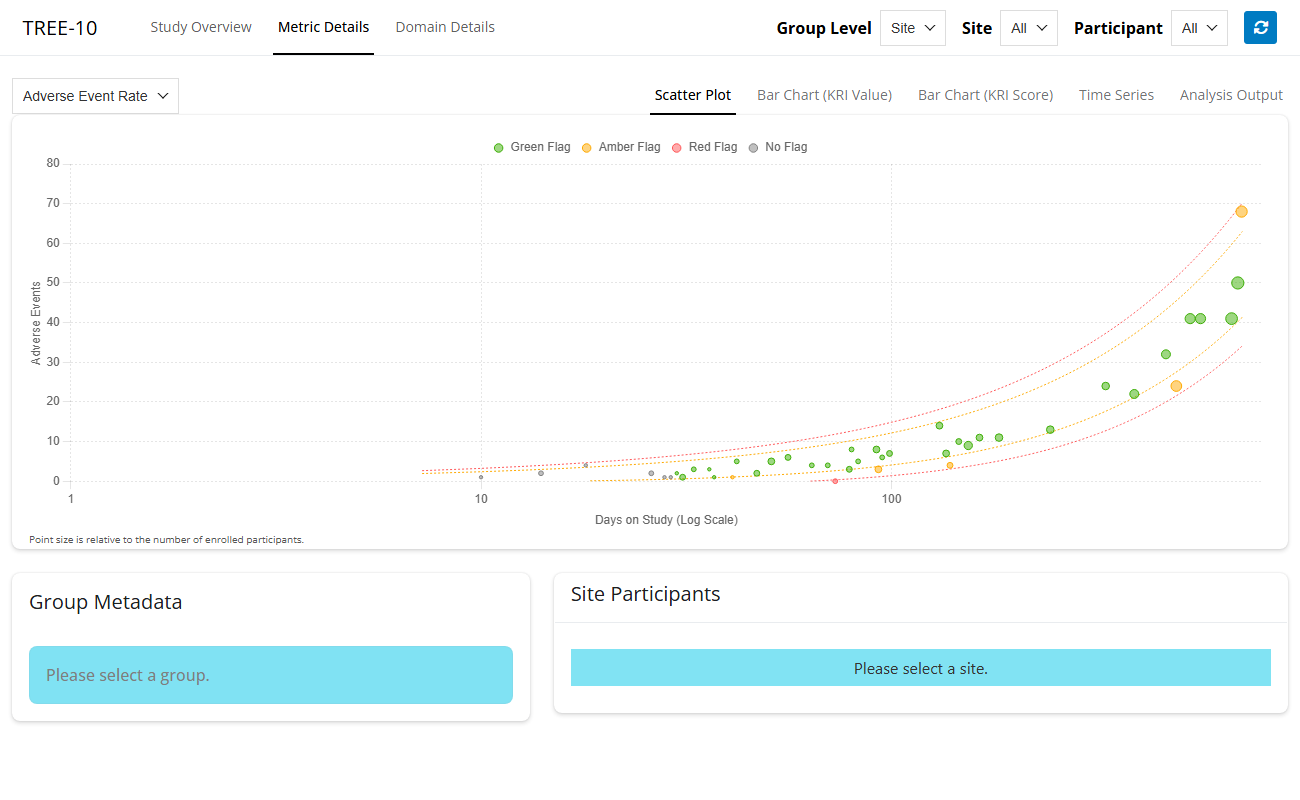
525: Feature: The user can view a set of interactive scatter plots, one for each KRI.
The interactive scatter plots are based on gsm.kri::Widget_ScatterPlot().
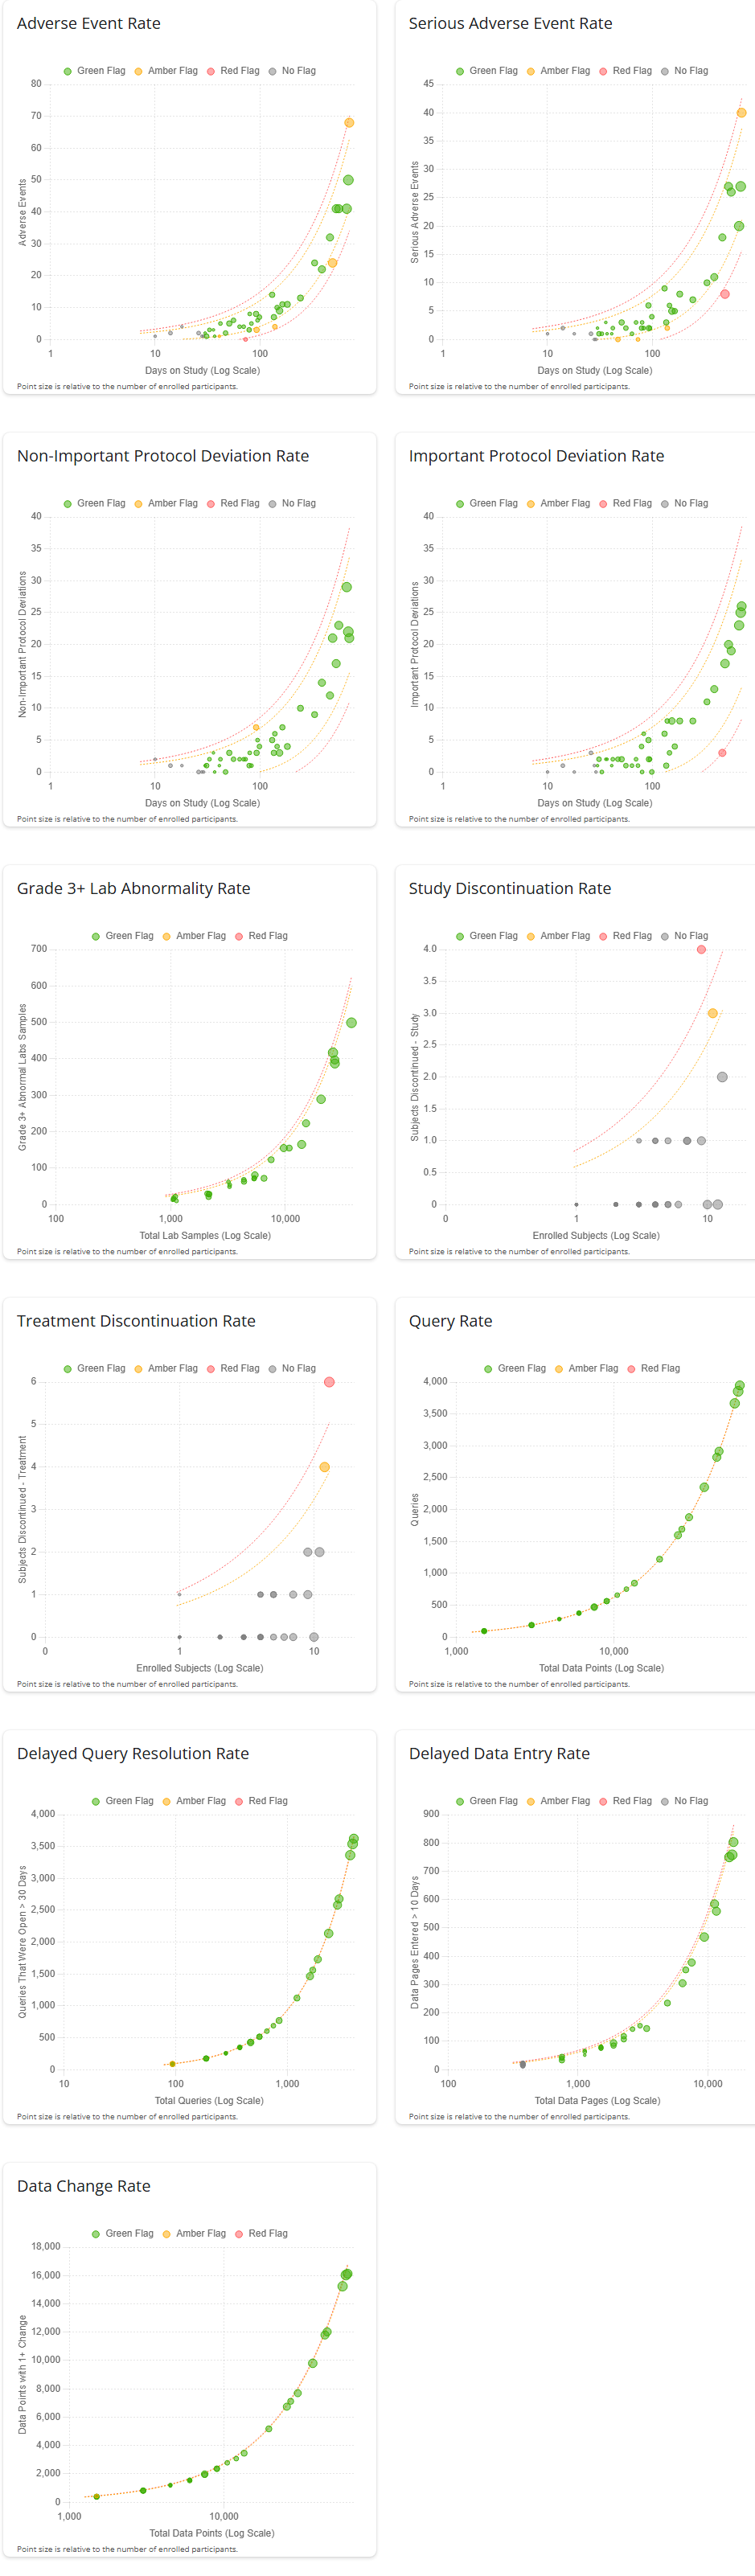
The set of scatter plots is filtered to show only plots relevant to the selected “Group Level”.
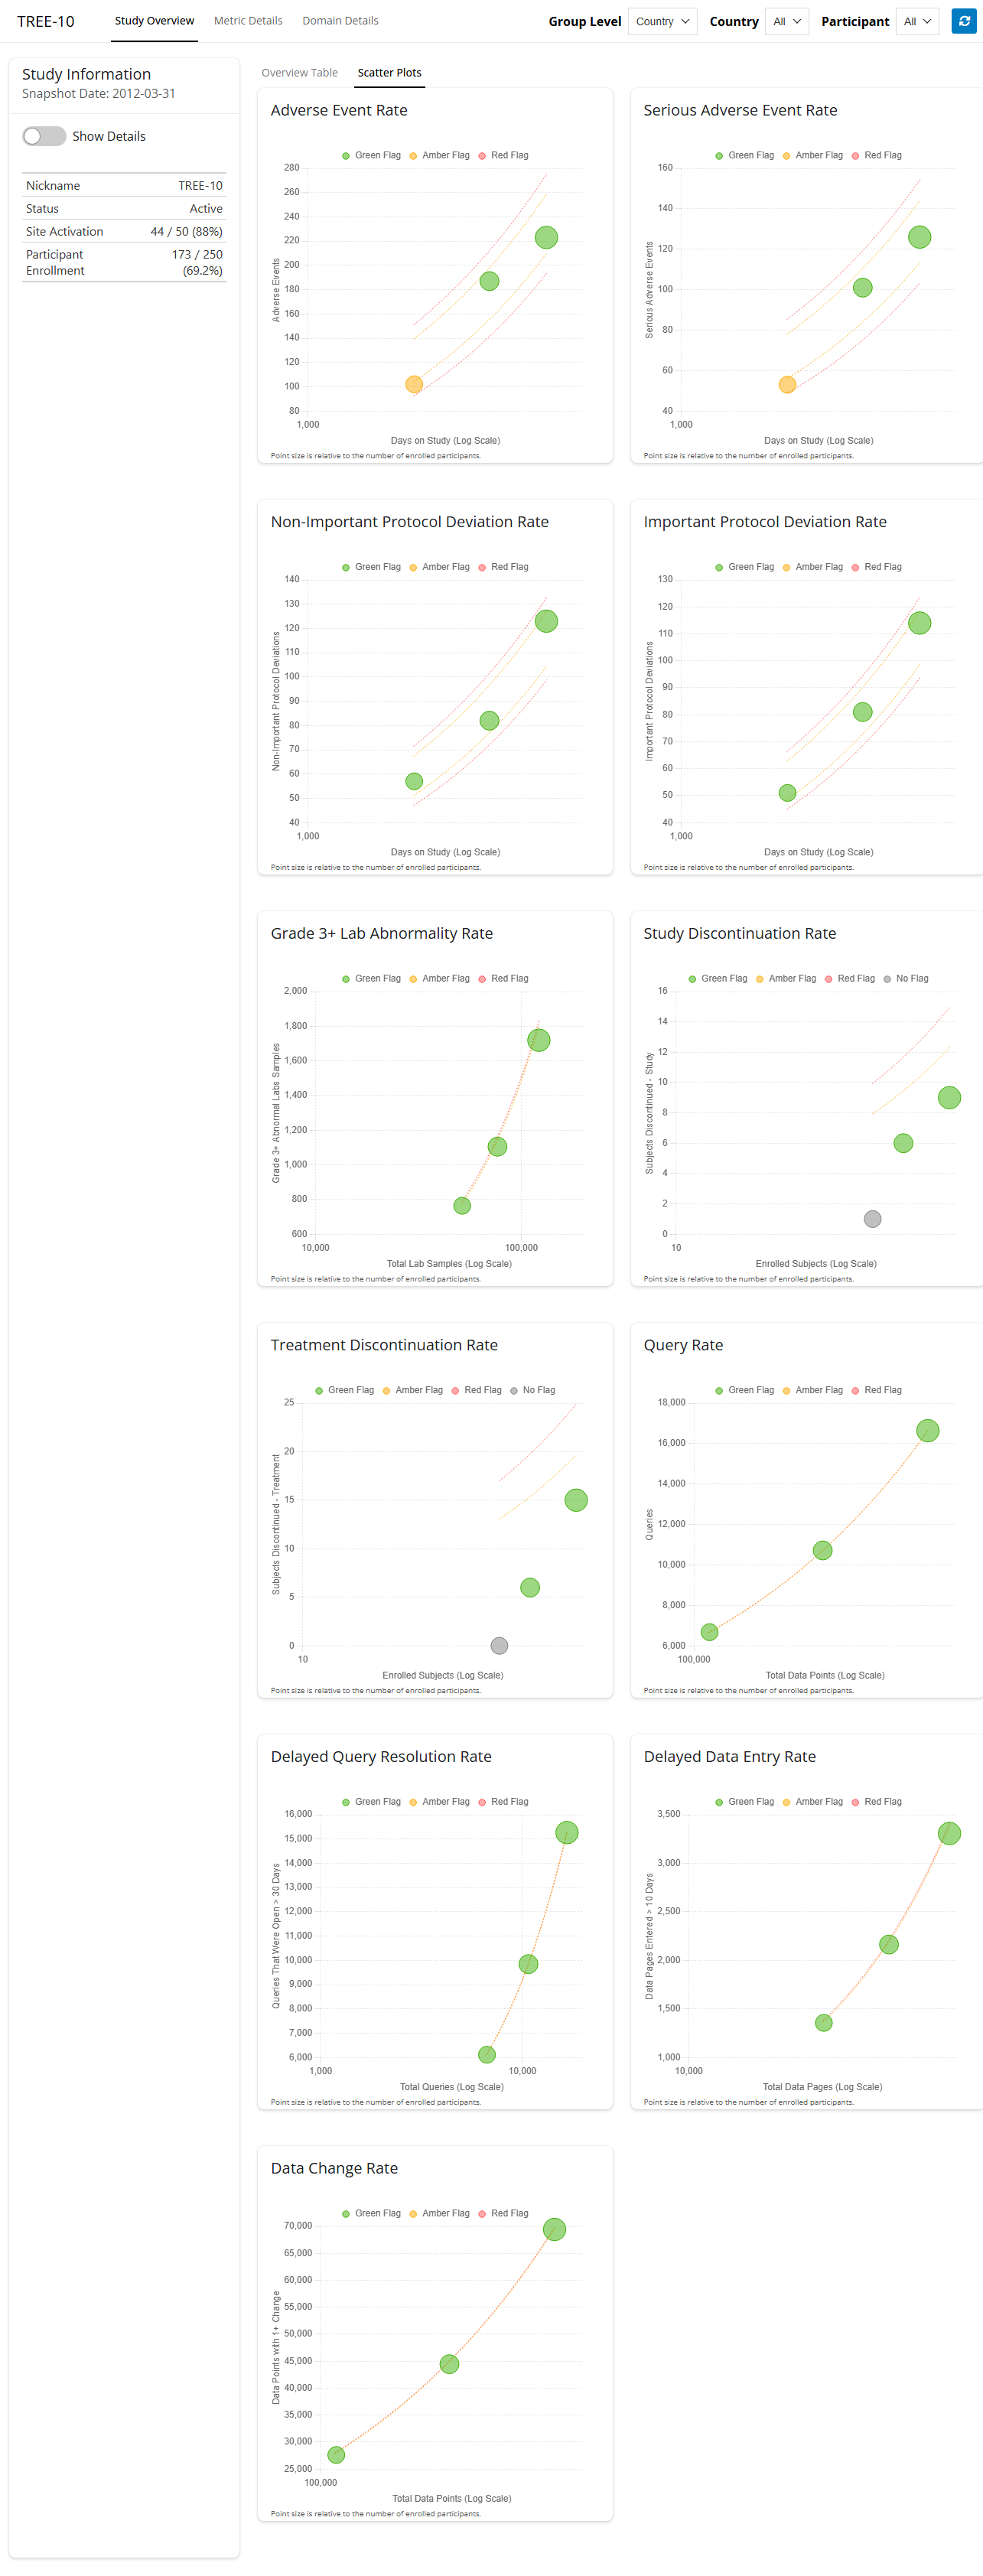
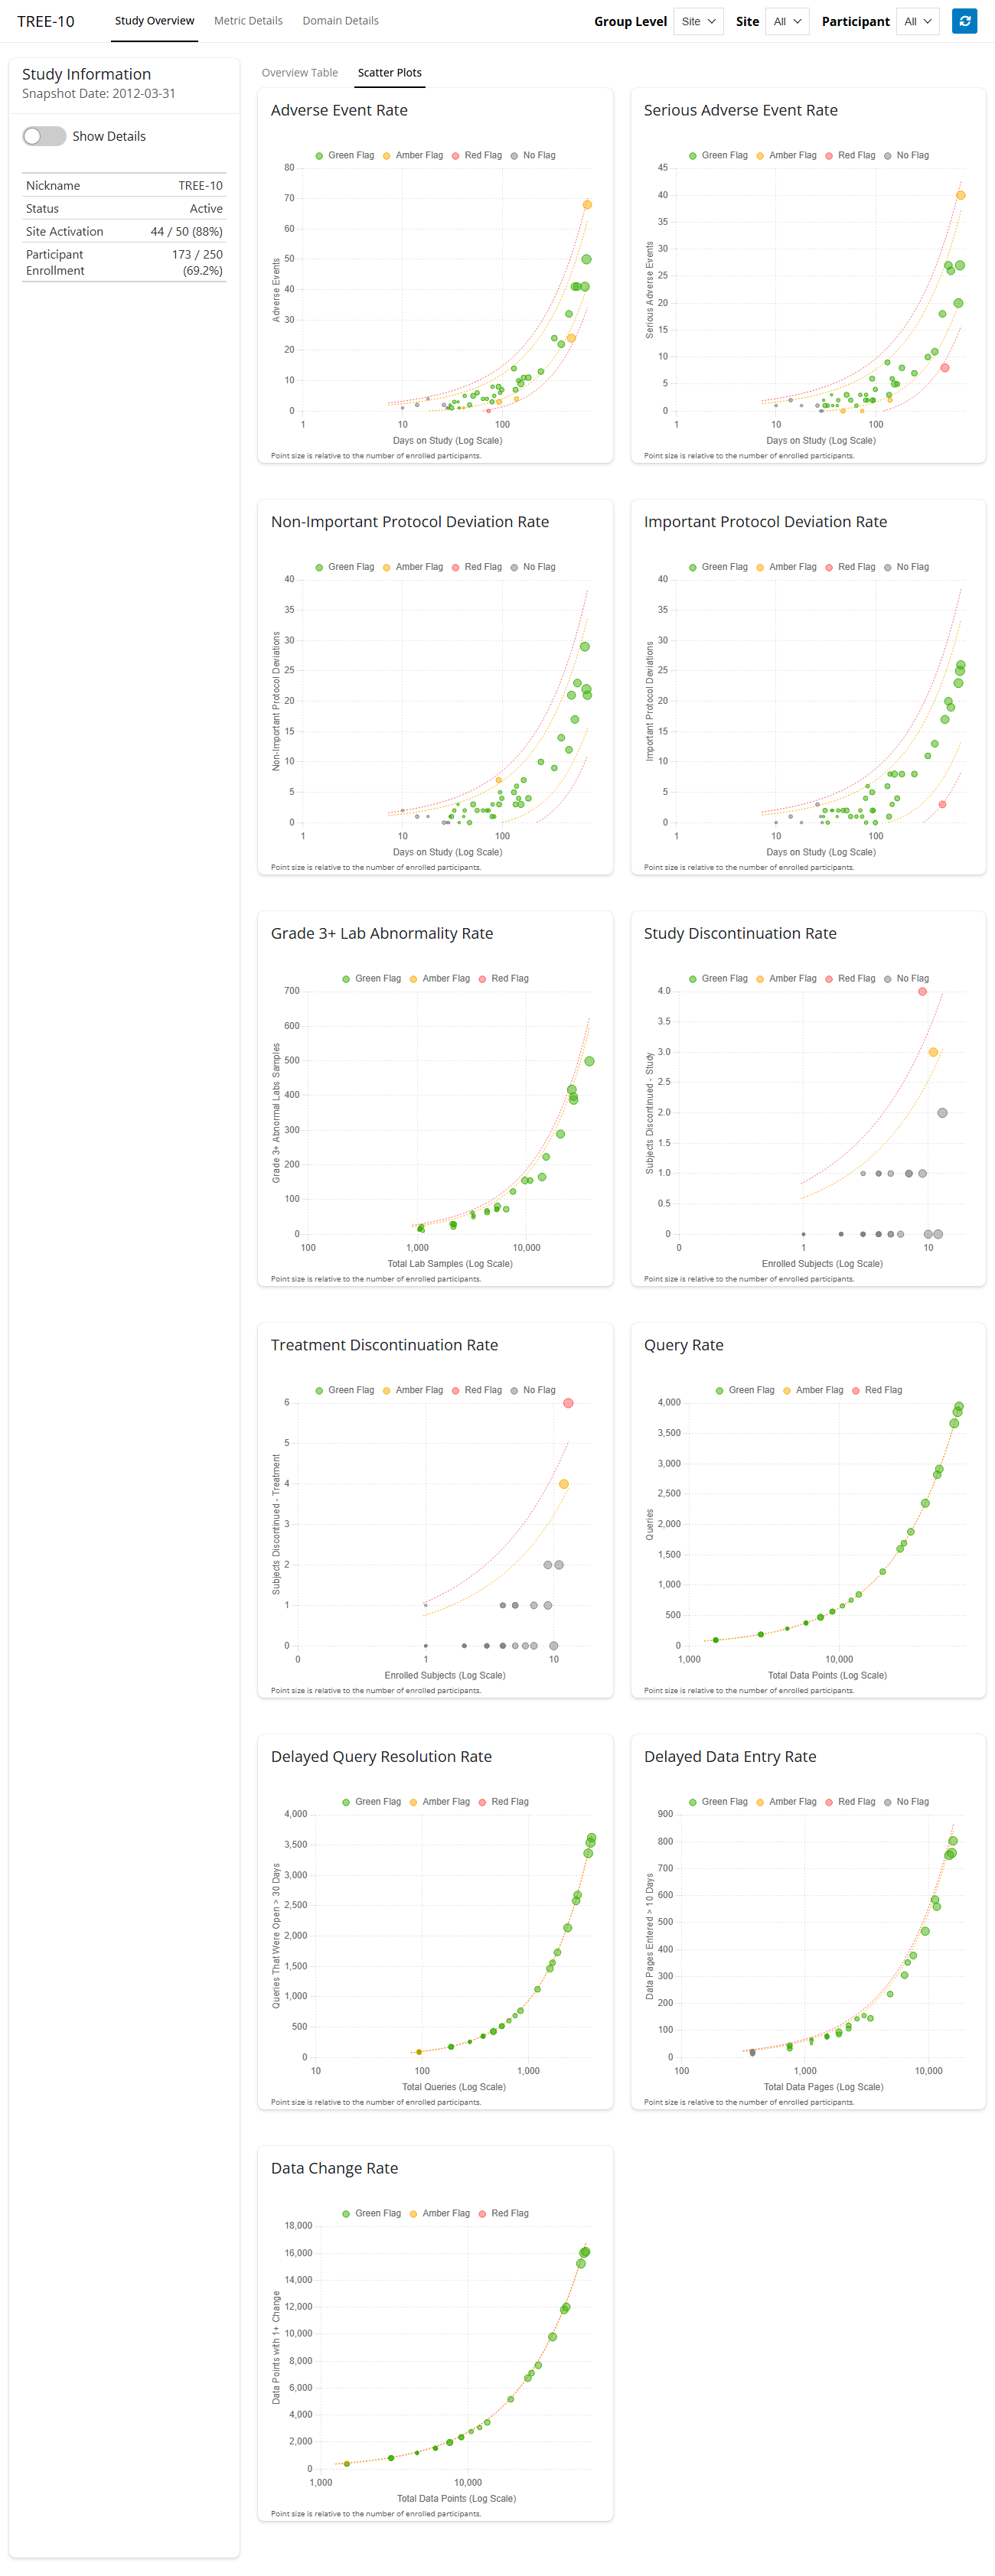
Clicking a point in a scatter plot navigates the user to the “Metric Details” tab, filtered to that KRI and group.
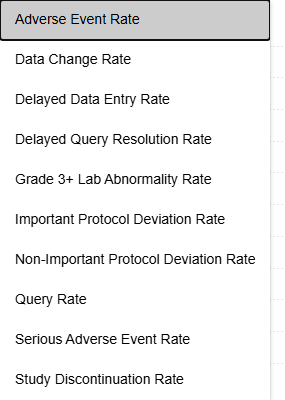
526: Feature: The user can view visualizations of a single KRI.
The user can select the KRI via a dropdown menu.

The KRI selection dropdown is filtered to show only KRIs relevant to the selected “Group Level”.

The user can navigate to different visualizations of this KRI via tabs.

527: Feature: The user can view an interactive scatter plot of the selected KRI’s latest results.
The interactive scatter plot is based on gsm.kri::Widget_ScatterPlot().
The selected group is highlighted in the interactive scatter plot.
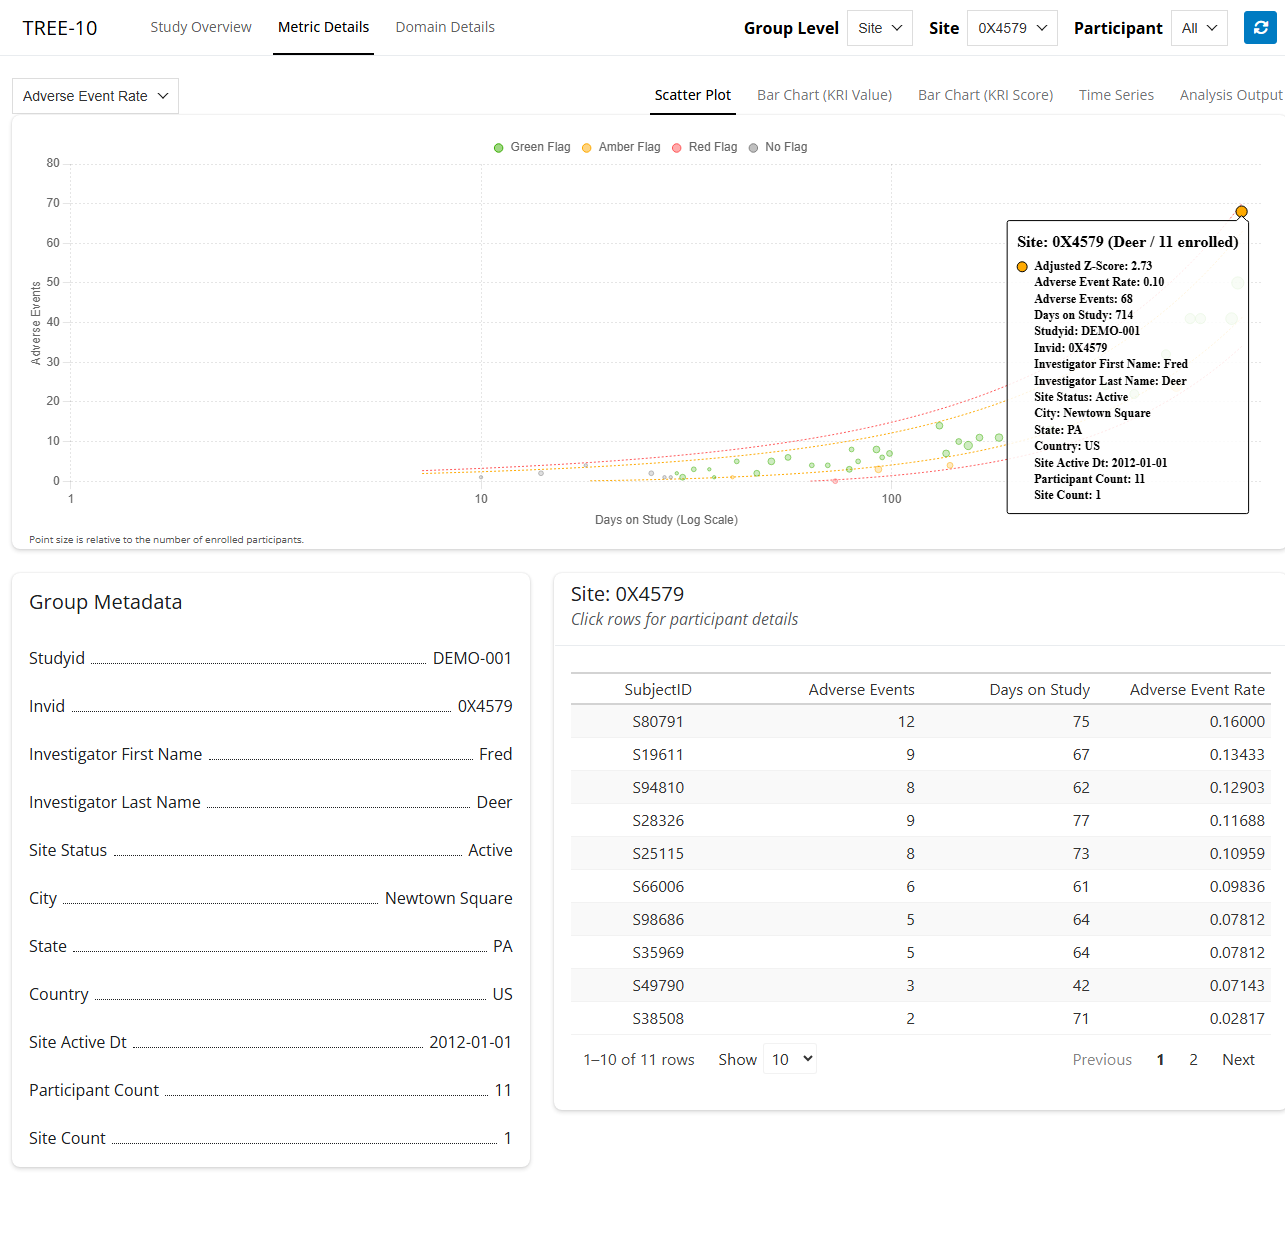
Clicking a group in the scatter plot updates the group drop-down.

528: Feature: The user can view an interactive bar chart of the selected KRI’s latest metric values.
The interactive bar chart (value) is based on gsm.kri::Widget_BarChart().
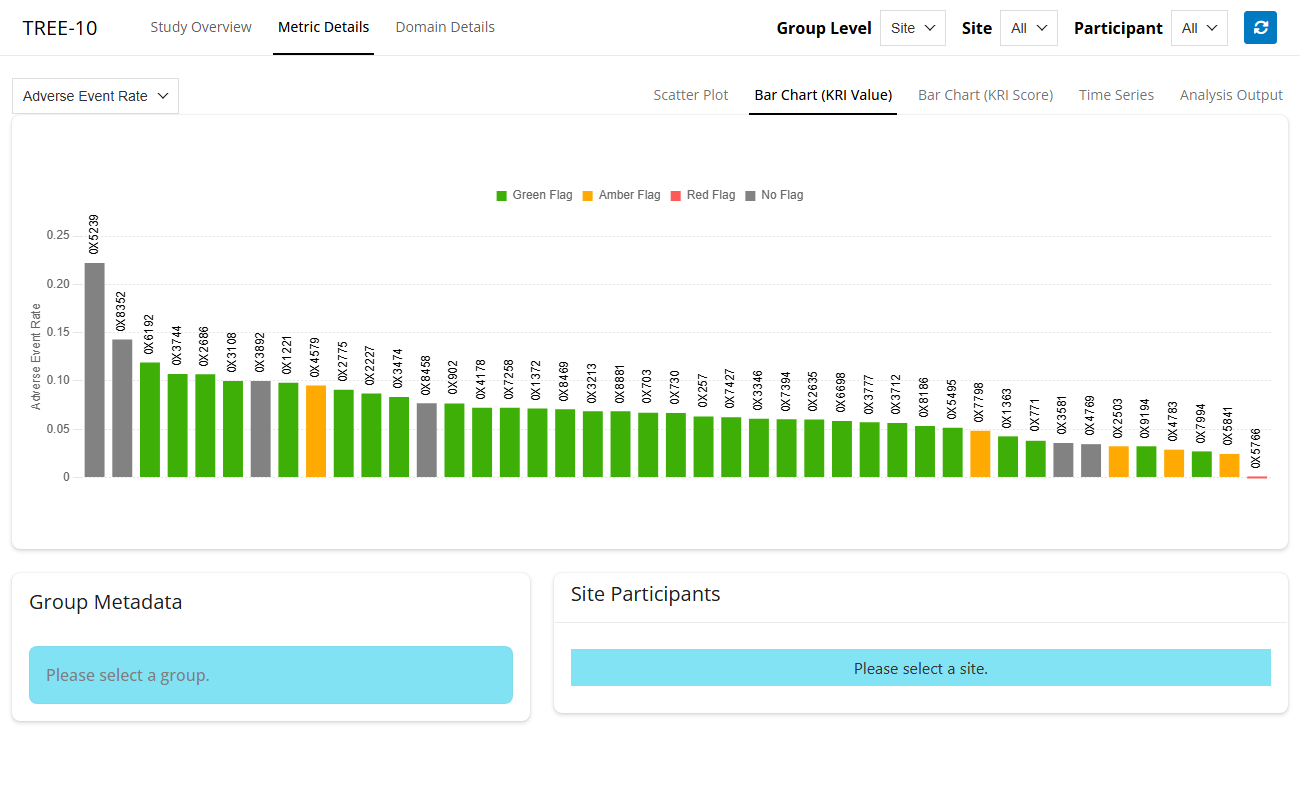
The selected group is highlighted in the interactive bar chart (value).
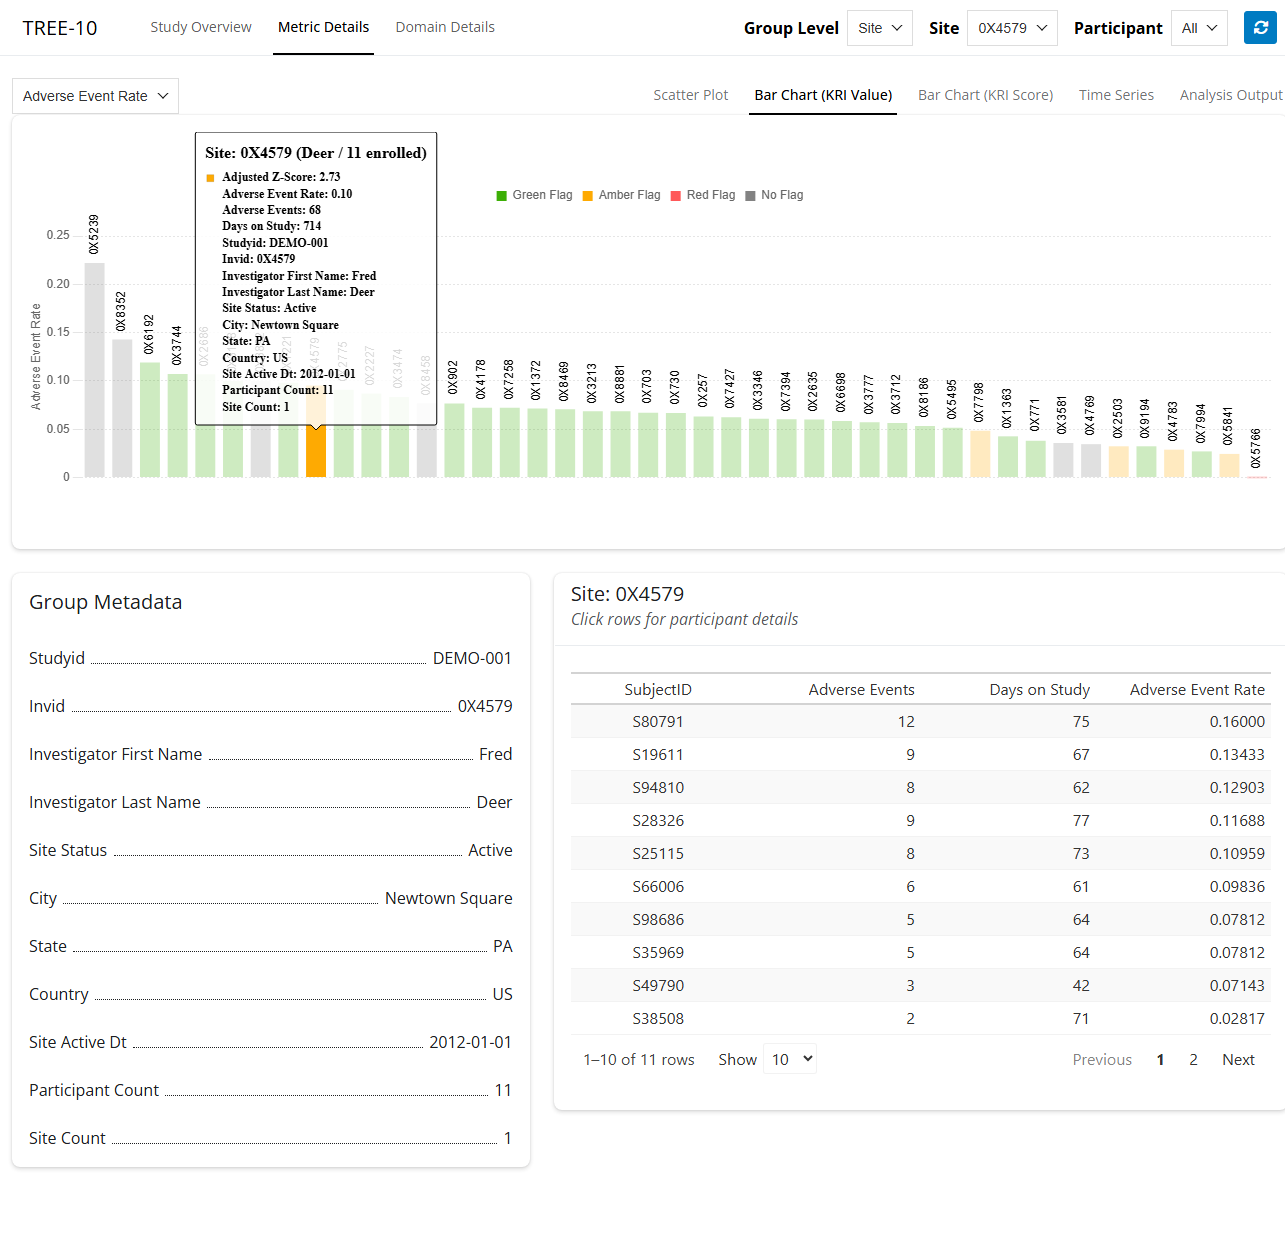
Clicking a group in the bar chart (value) updates the group drop-down.

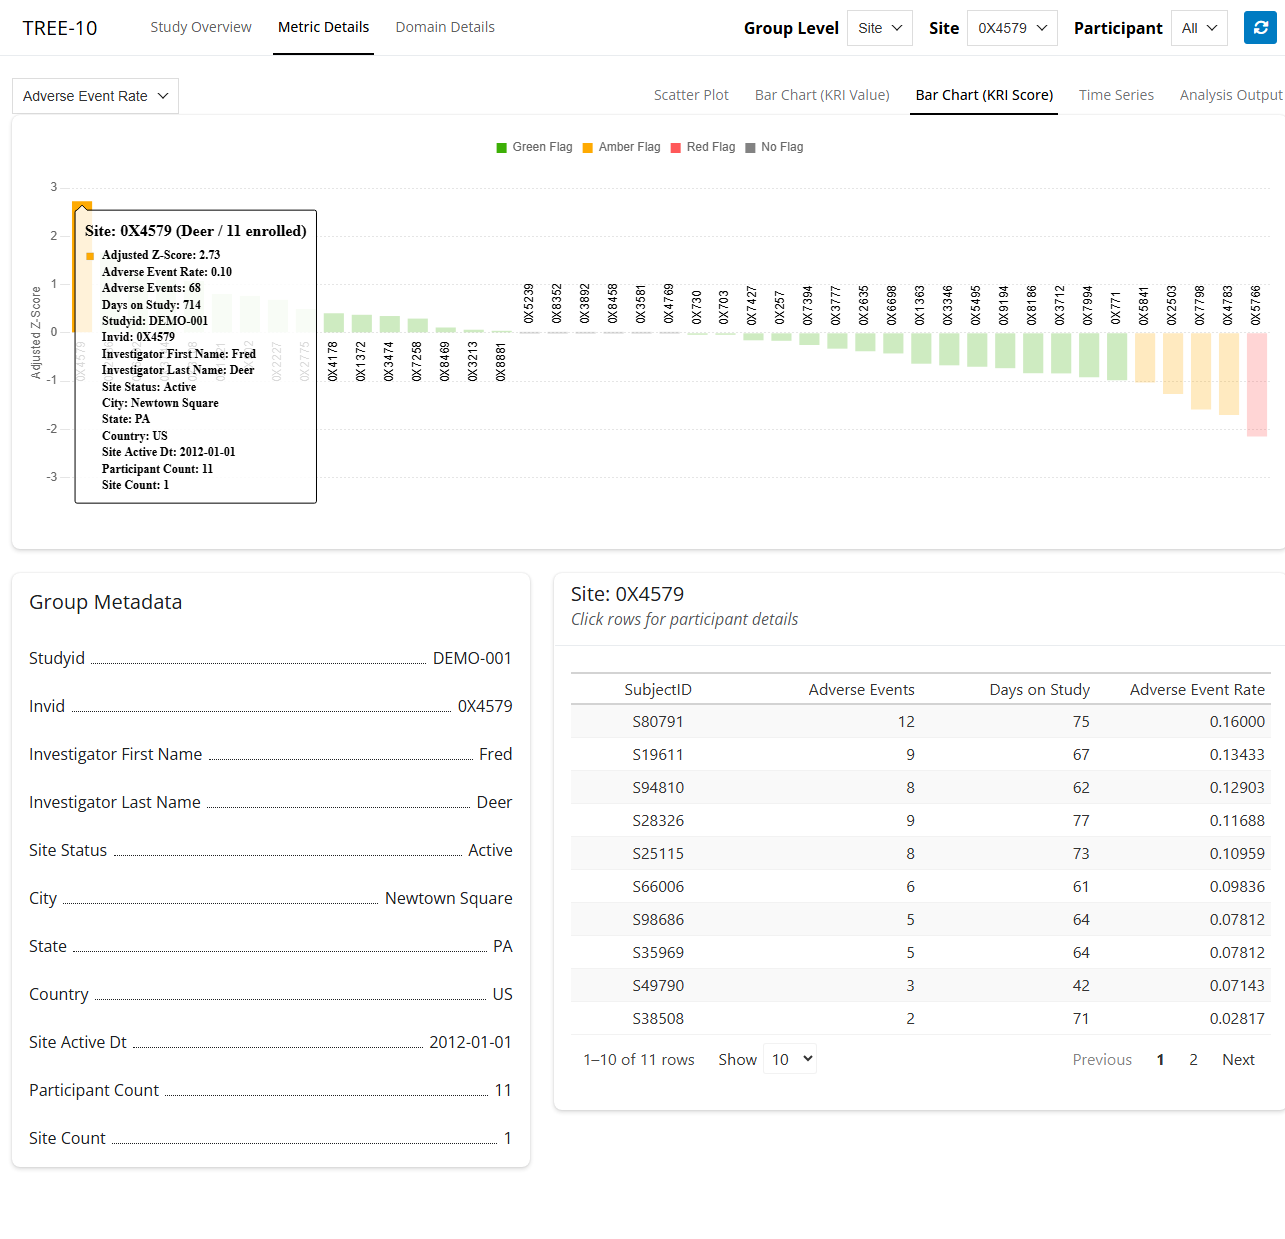
529: Feature: The user can view an interactive bar chart of the selected KRI’s latest scores.
The interactive bar chart (score) is based on gsm.kri::Widget_BarChart().
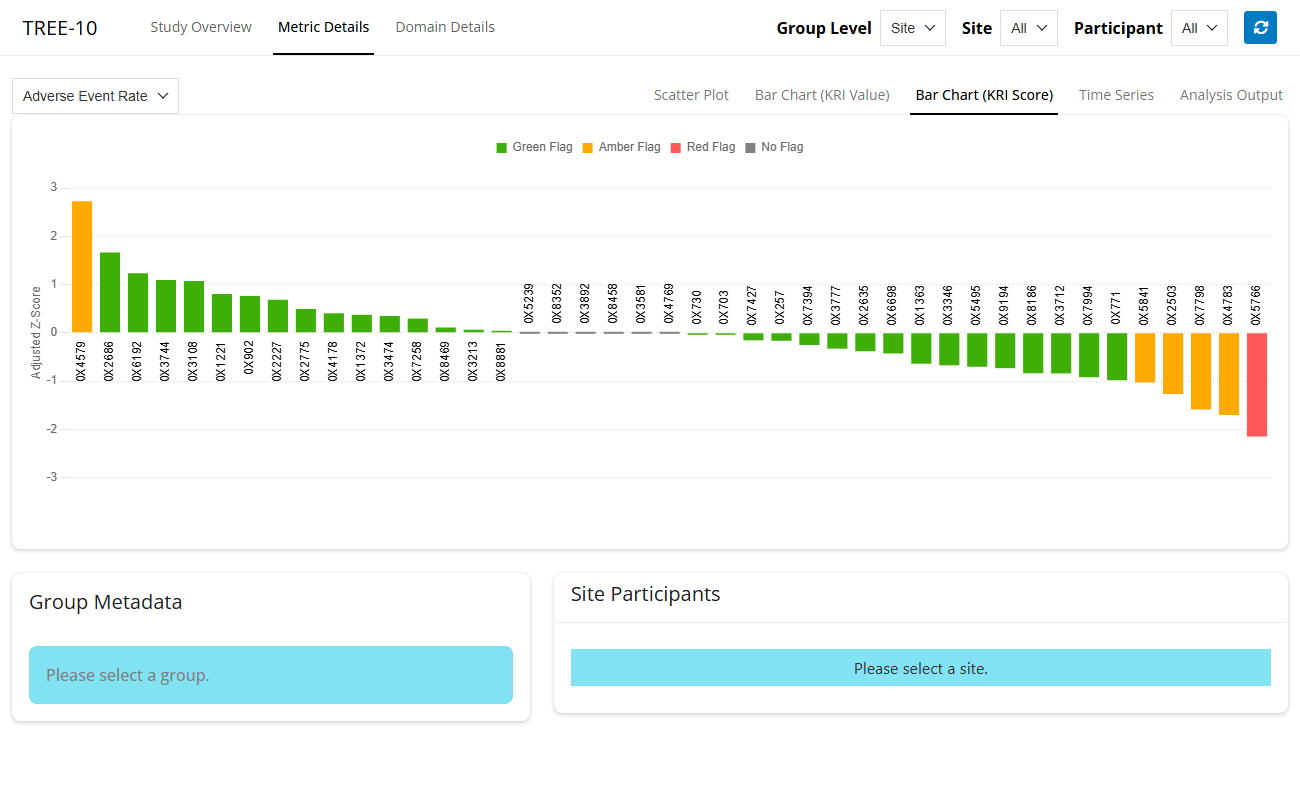
The selected group is highlighted in the interactive bar chart (score).

Clicking a group in the bar chart (score) updates the group drop-down.
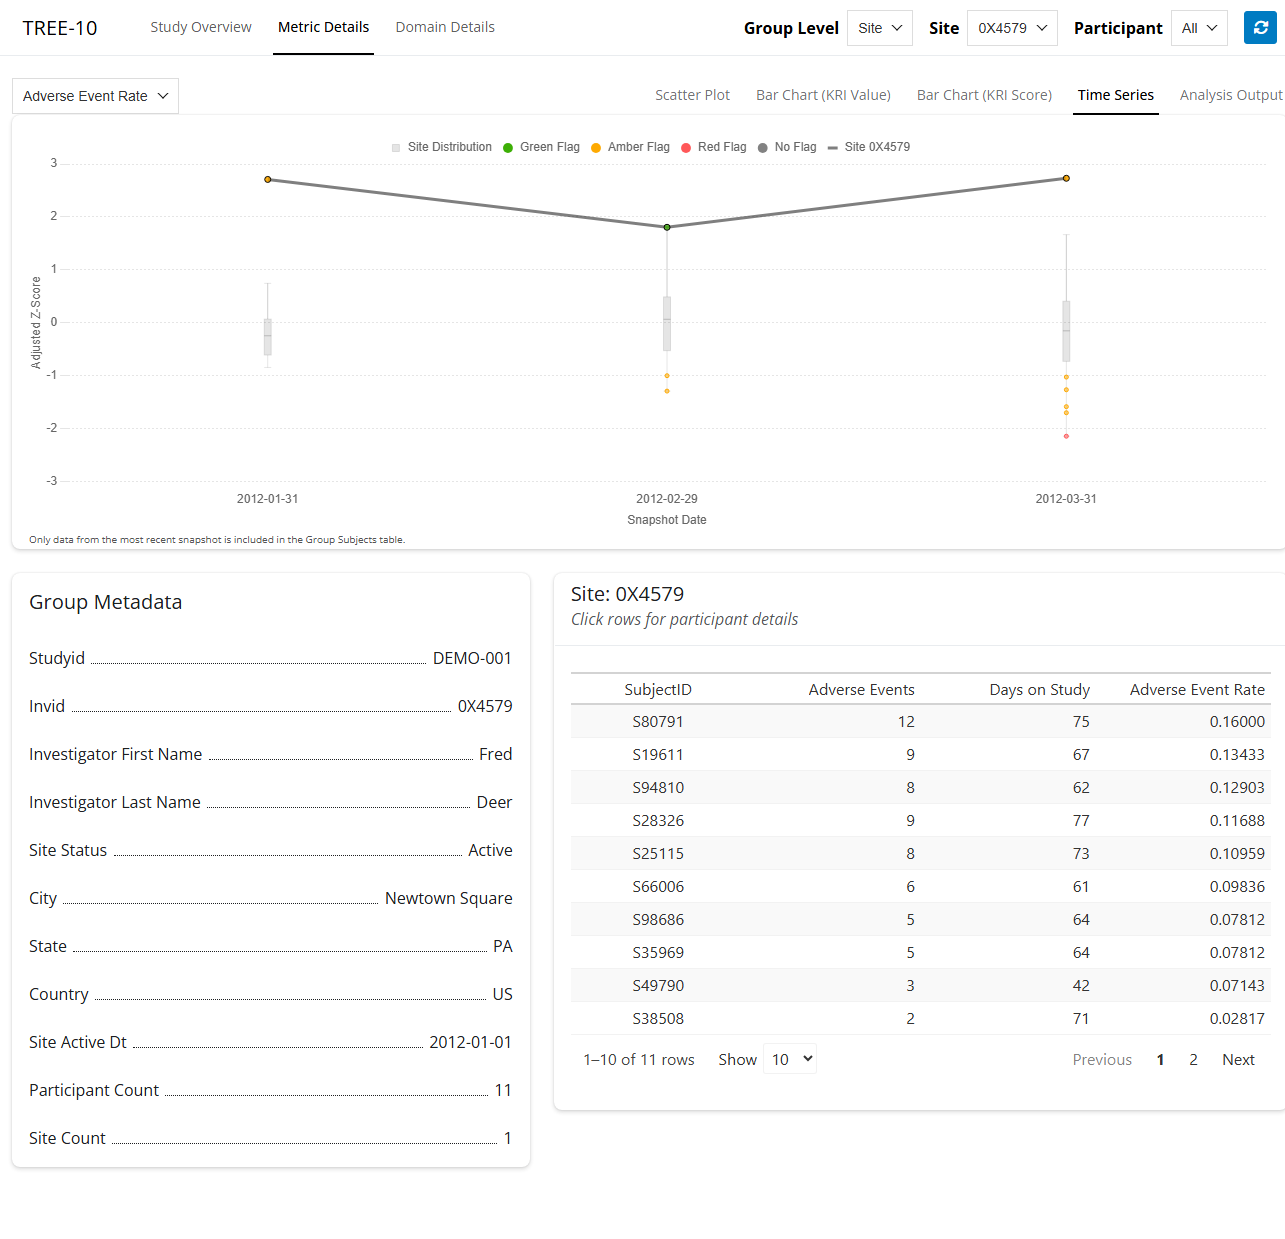
530: Feature: The user can view an interactive time-series plot of the selected KRI’s scores across all available data snapshots.
The interactive time-series plot is based on gsm.kri::Widget_TimeSeries().
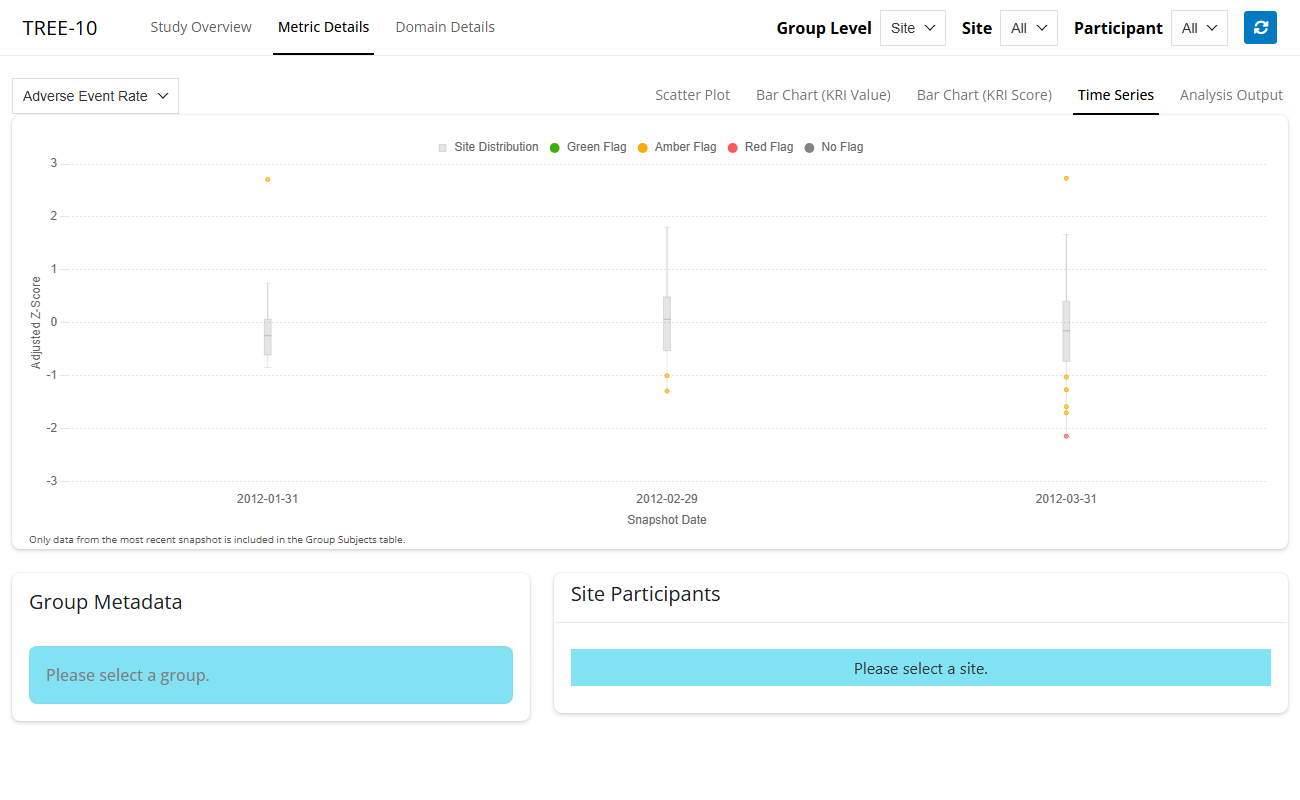
The selected group is highlighted in the interactive time-series plot.

Clicking a group in the time-series plot updates the group drop-down.
531: Feature: The user can view a table of the KRI results for each group.
The KRI results table is generated by gsm.kri::Report_MetricTable().
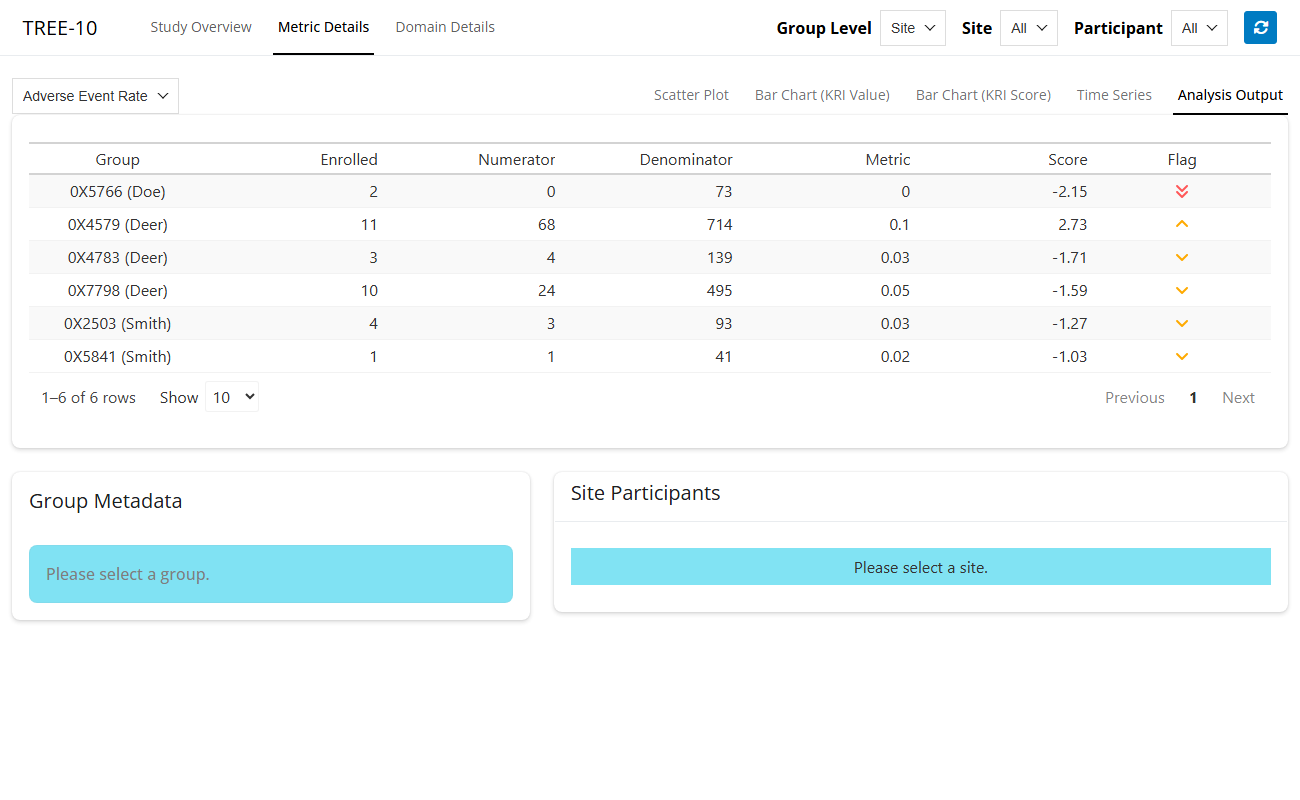
The selected group is highlighted in the KRI results table.
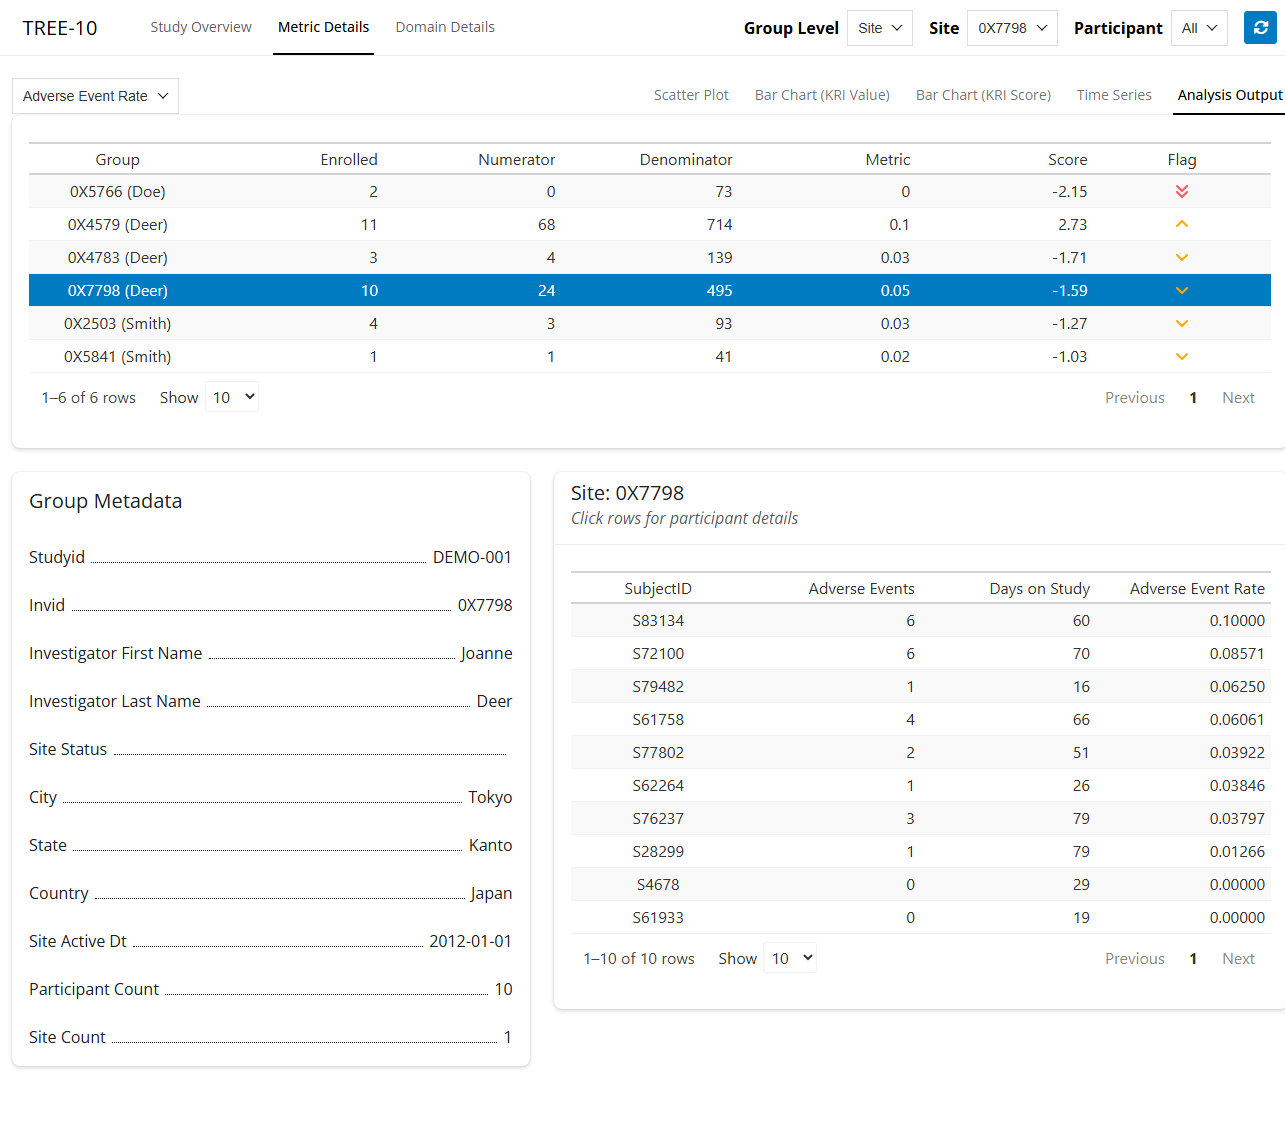
Clicking a group in the KRI results table updates the group drop-down.
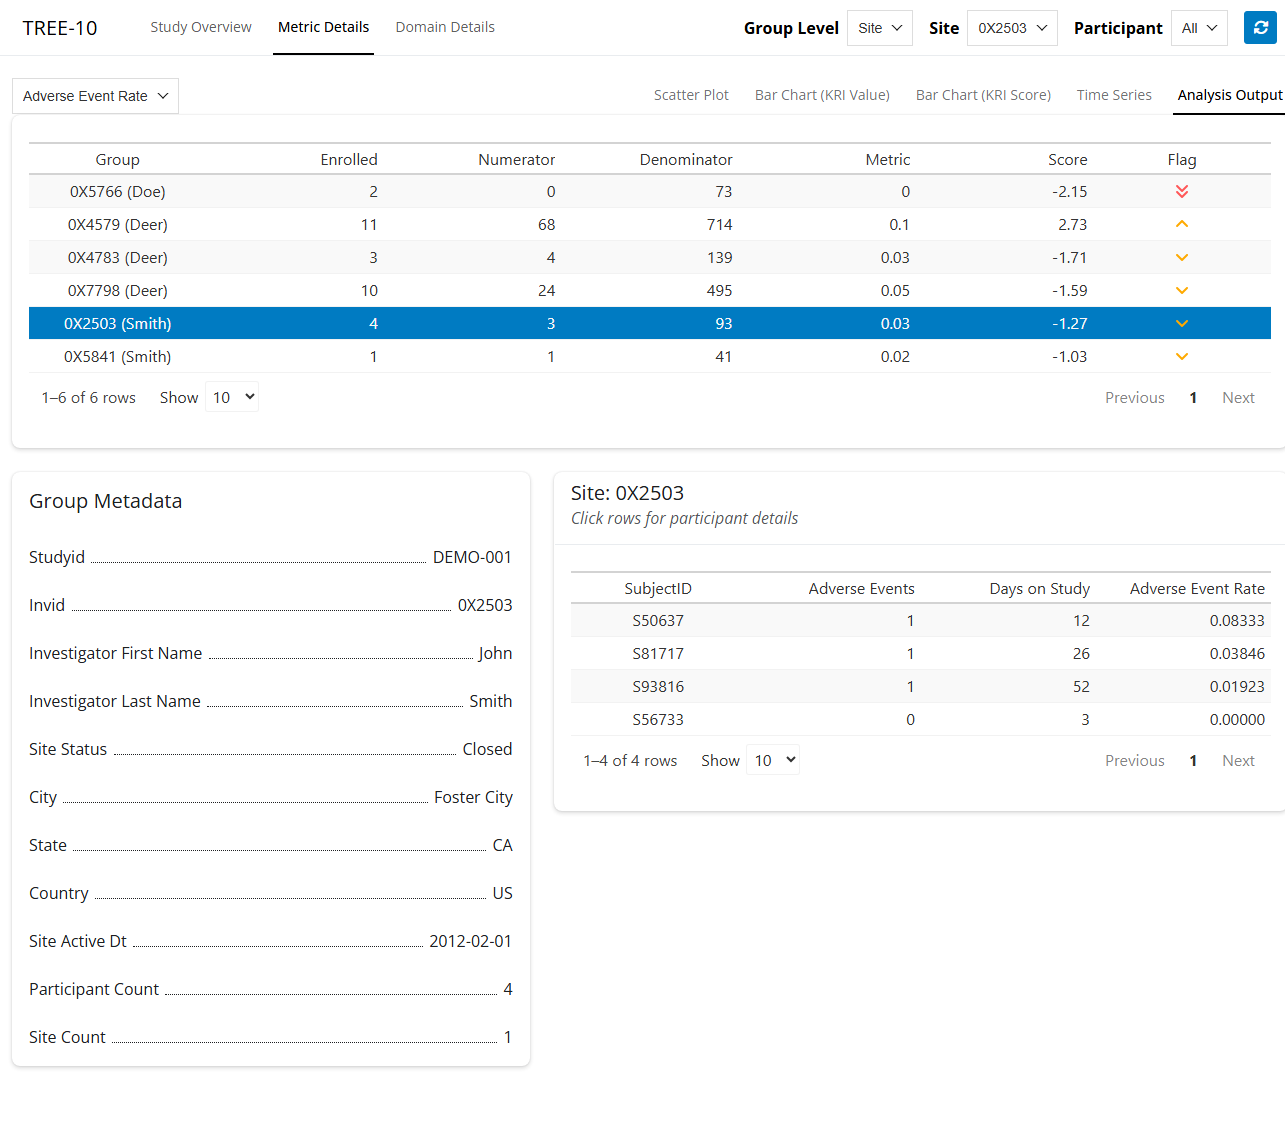
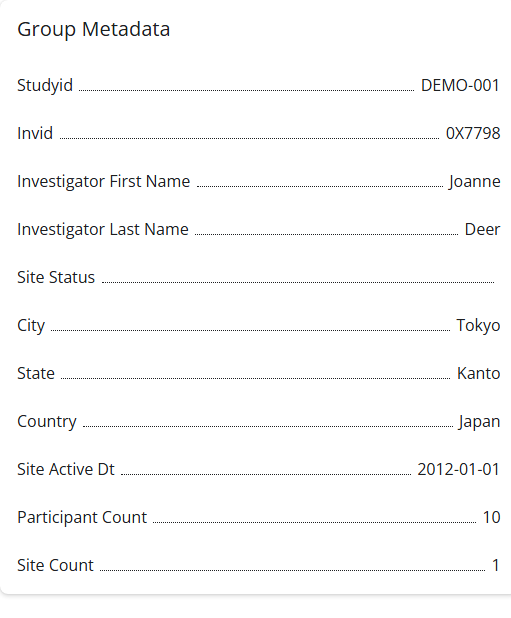
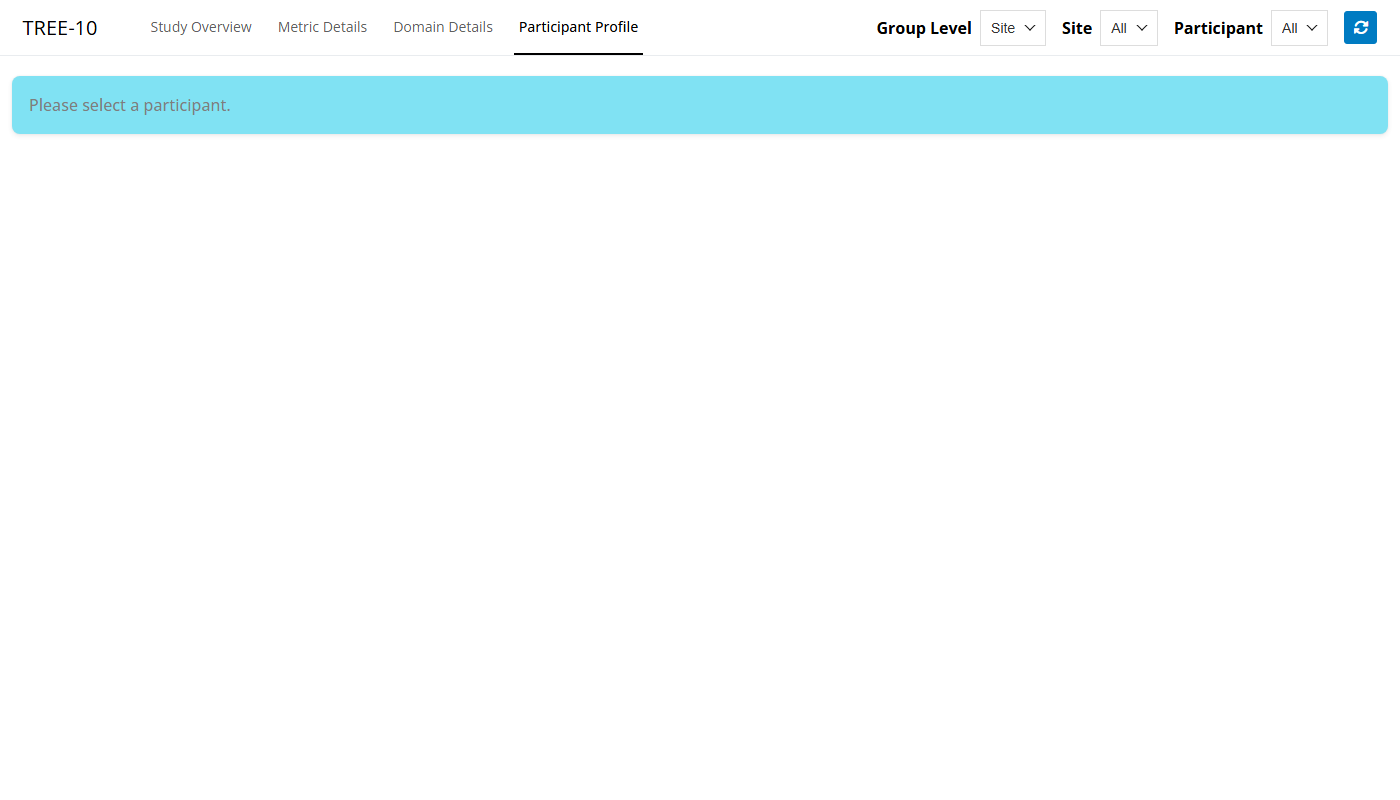
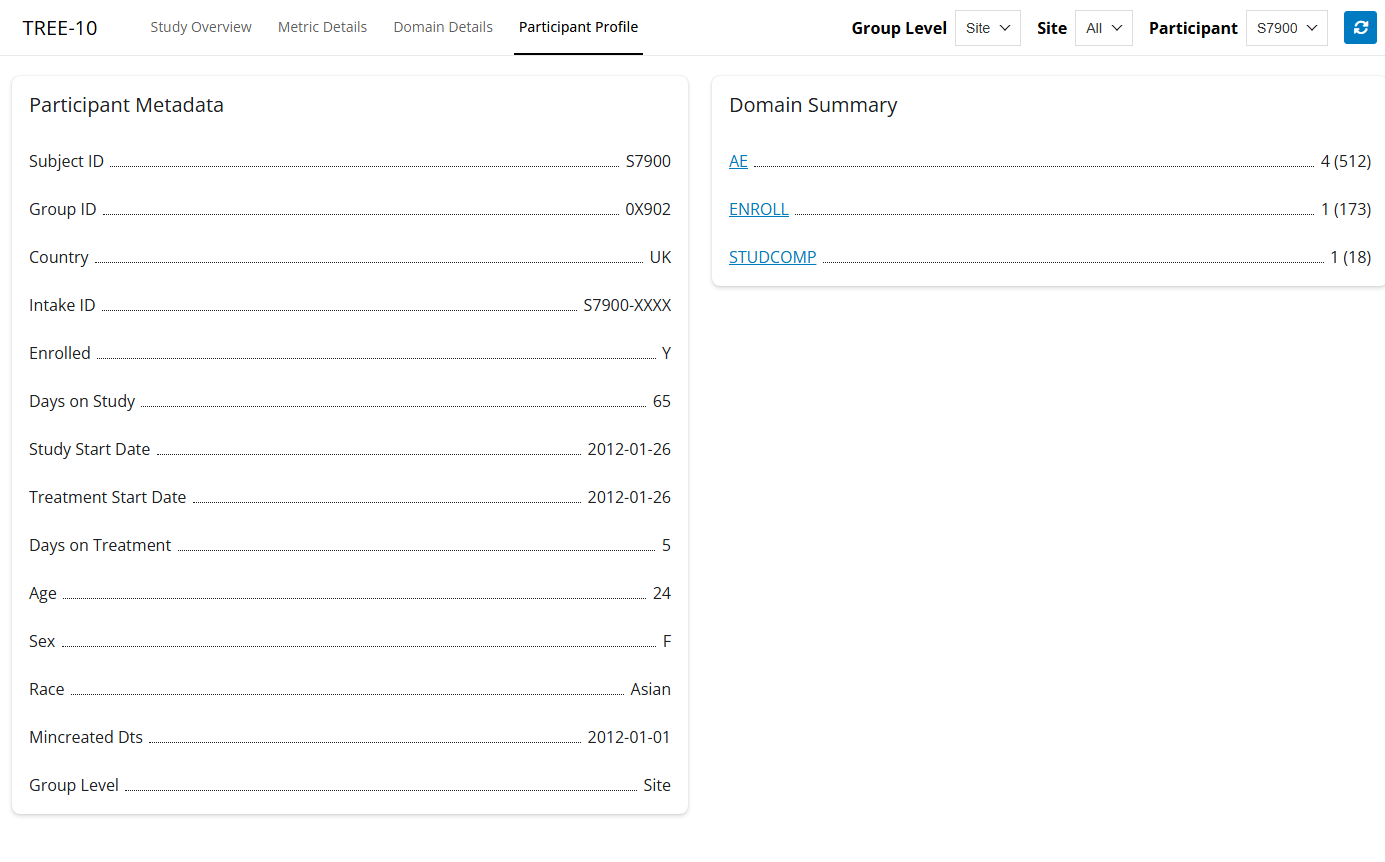
532: Feature: When a group is selected, the user can view that group’s metadata.
The group metadata contains all information about this Group from the dfGroups input table.
533: Feature: When a group is selected, the user can view a table of participants within that group.
The participant table shows each participant’s numerator, denominator, and metric values for the selected KRI.
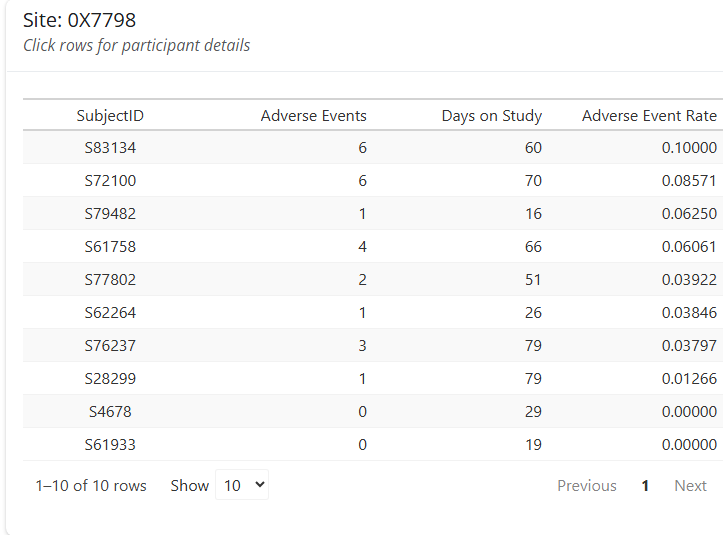
Clicking a participant in the participant table selects that participant and navigates to the Domain Details tab.
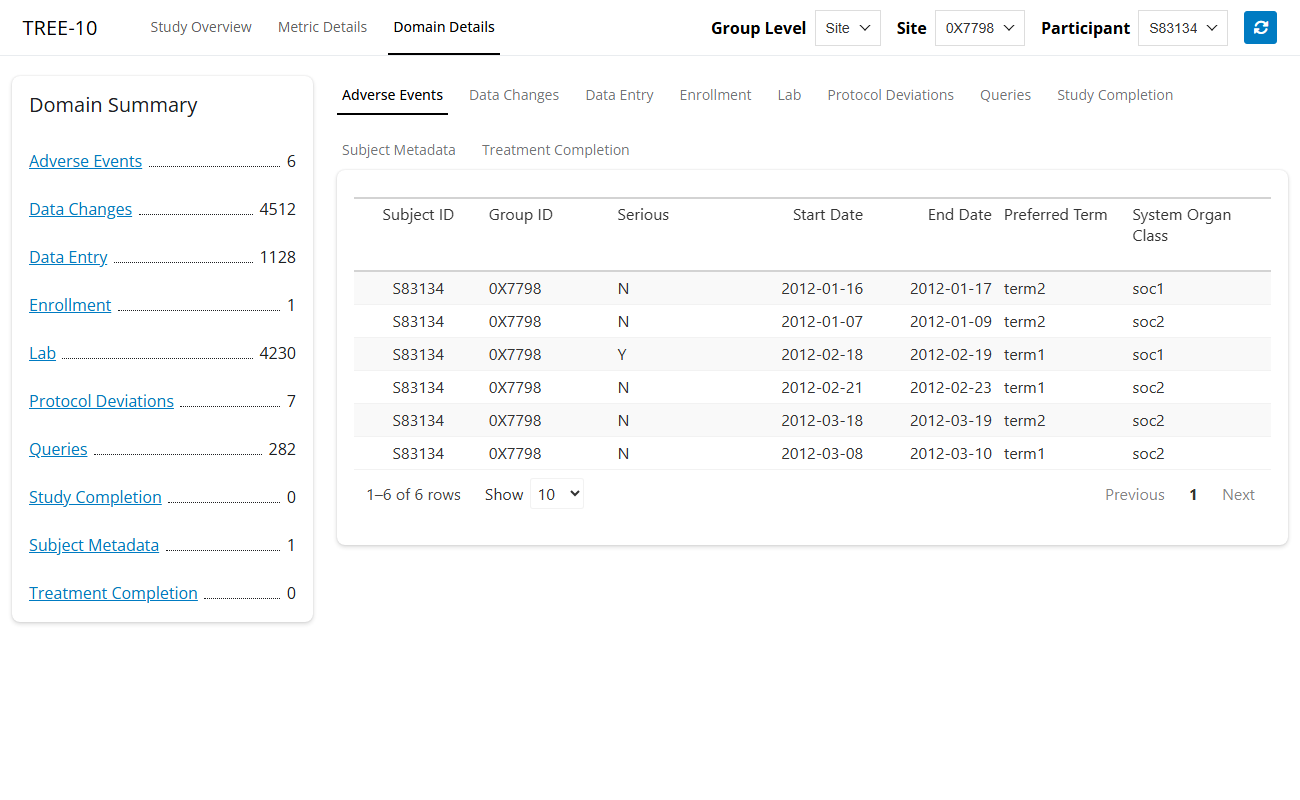
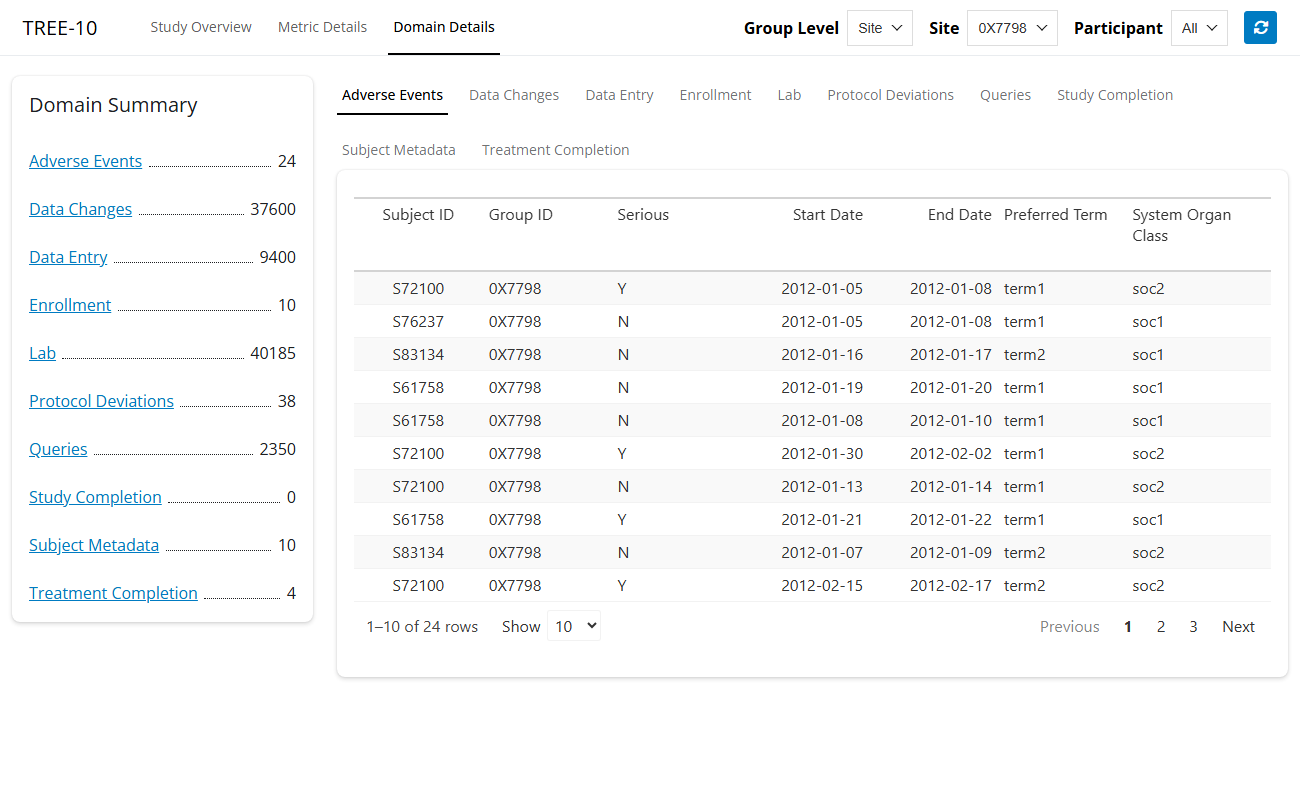
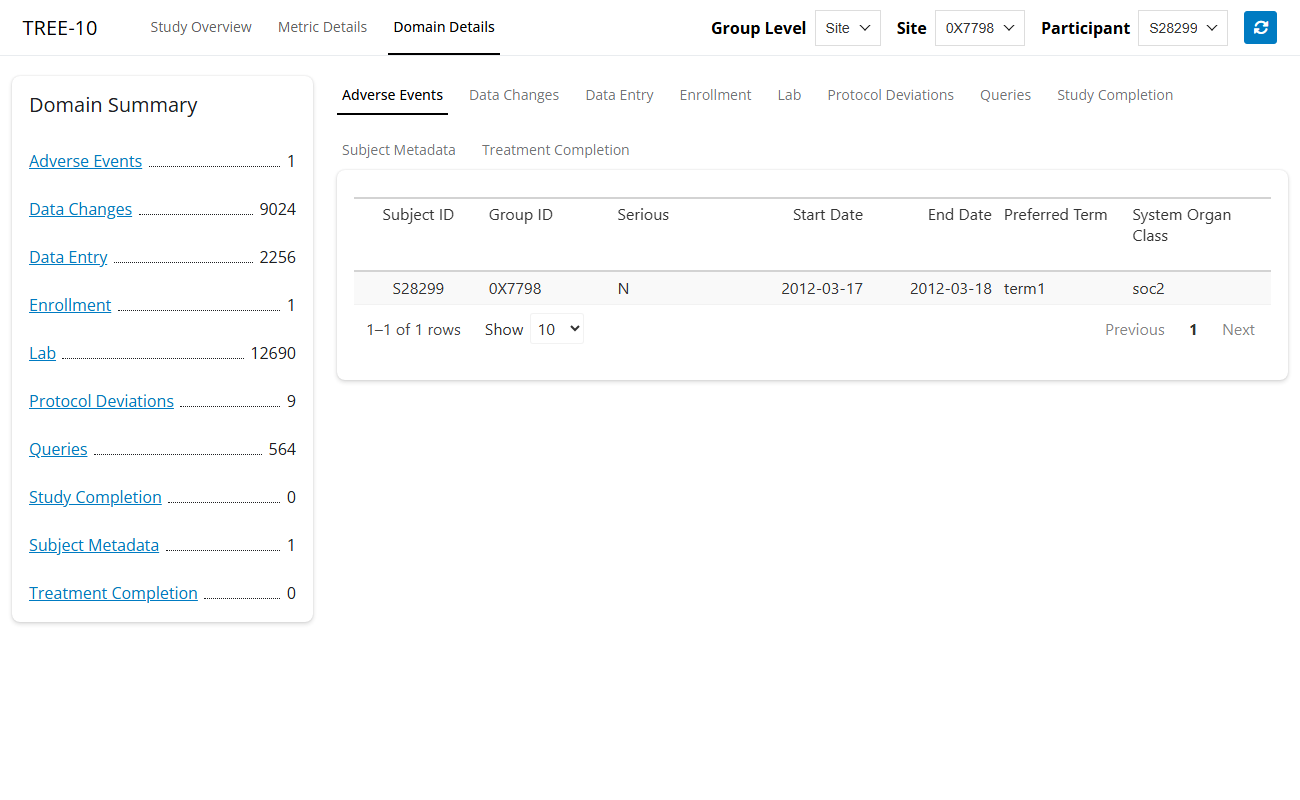
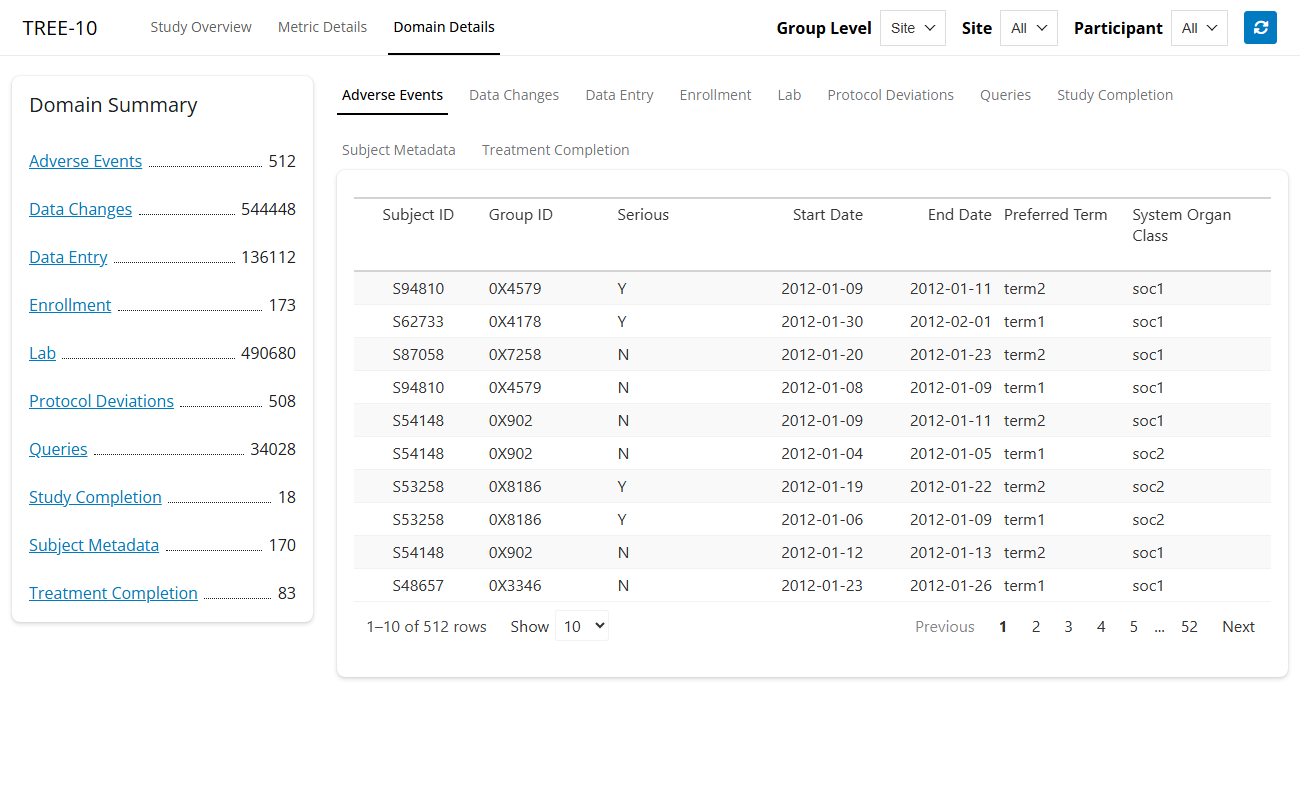
534: Feature: The user can view raw domain data.
The user can switch between different domain data views using a set of tabs.

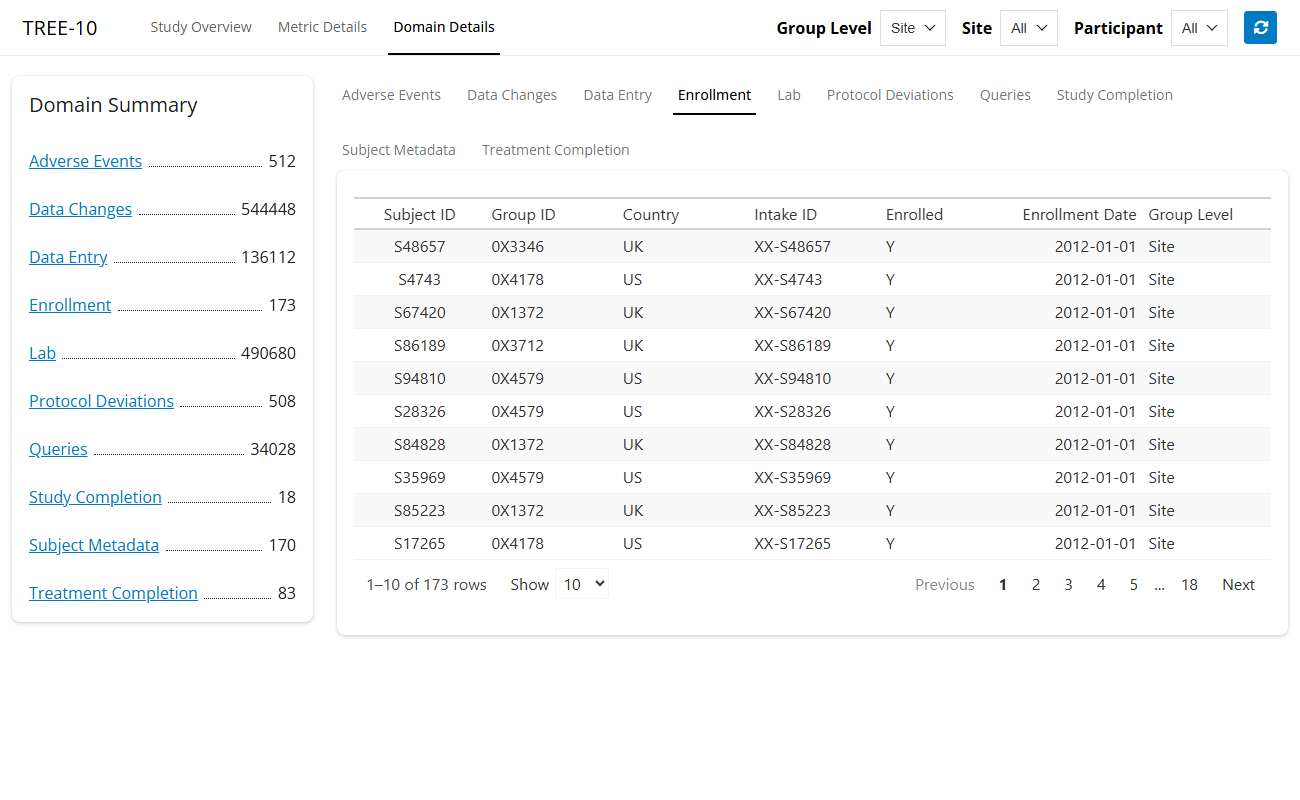
The user can view the raw data for the selected domain in a table.

The domain data table is filtered by the selected “Group” and “Participant”.
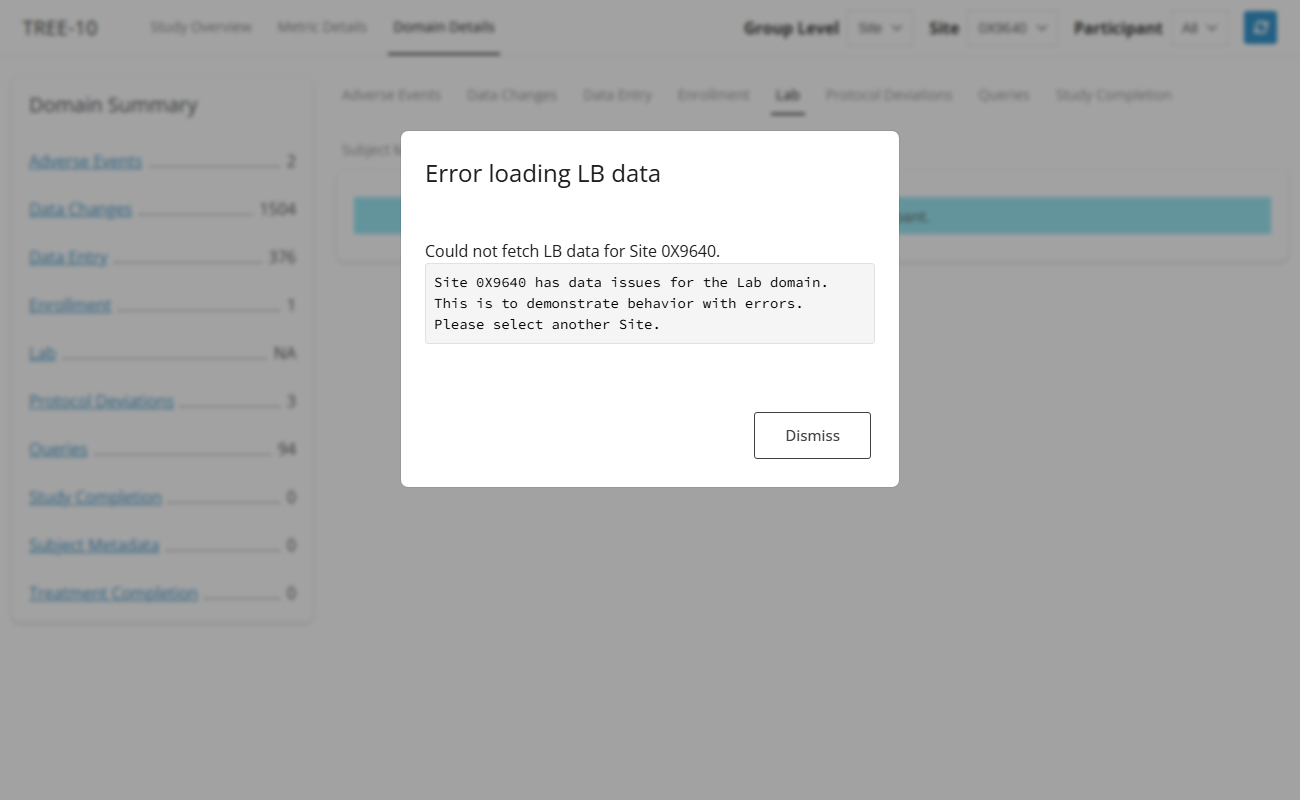
The app displays an error message if it is unable to load data for a specific domain.
535: Feature: The user can view a summary of the number of records for each available data domain.
This feature has been superseded by one or more later features. See the GitHub issue for details.
536: Feature: The user can view tabs provided by plugins.
If a single plugin is included in the app, it appears as a new tab.

If a plugin specifies required inputs, a placeholder is shown if that input is set to “All”.
If multiple plugins are provided, they are grouped under a “Plugins” dropdown menu in the navigation bar.