`r lifecycle::badge("stable")`
Usage
Visualize_Score(
  dfResults,
  vThreshold = NULL,
  strType = "Metric",
  bFlagFilter = FALSE,
  strTitle = ""
)
Arguments
- dfResults
`data.frame` A stacked summary of analysis pipeline output. Created by passing a list of results returned by [Summarize()] to [BindResults()]. Expected columns: `GroupID`, `GroupLevel`, `Numerator`, `Denominator`, `Metric`, `Score`, `Flag`, `MetricID`, `StudyID`, `SnapshotDate`.
- vThreshold
`numeric` Threshold specification, a vector of length 2 that defaults to NULL.
- strType
`character` One of `"KRI"` or `"score"`.
- bFlagFilter
`logical` Filter out non-flagged groups? Default: `FALSE`
- strTitle
`character` Title of plot.
Examples
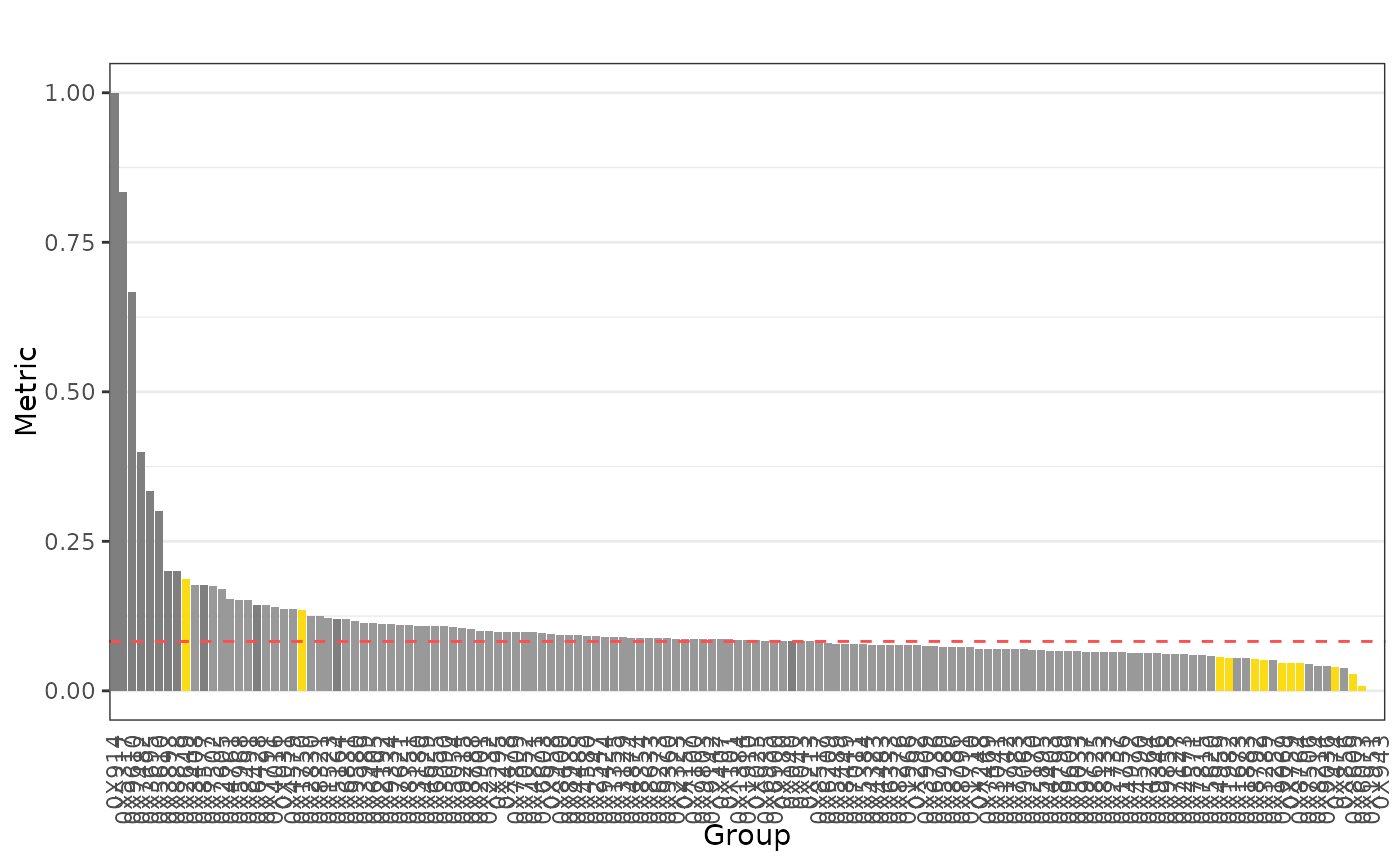
## Filter data to one metric and snapshot
reportingResults_filter <- gsm.core::reportingResults %>%
dplyr::filter(MetricID == "Analysis_kri0001" & SnapshotDate == max(SnapshotDate))
Visualize_Score(dfResults = reportingResults_filter)
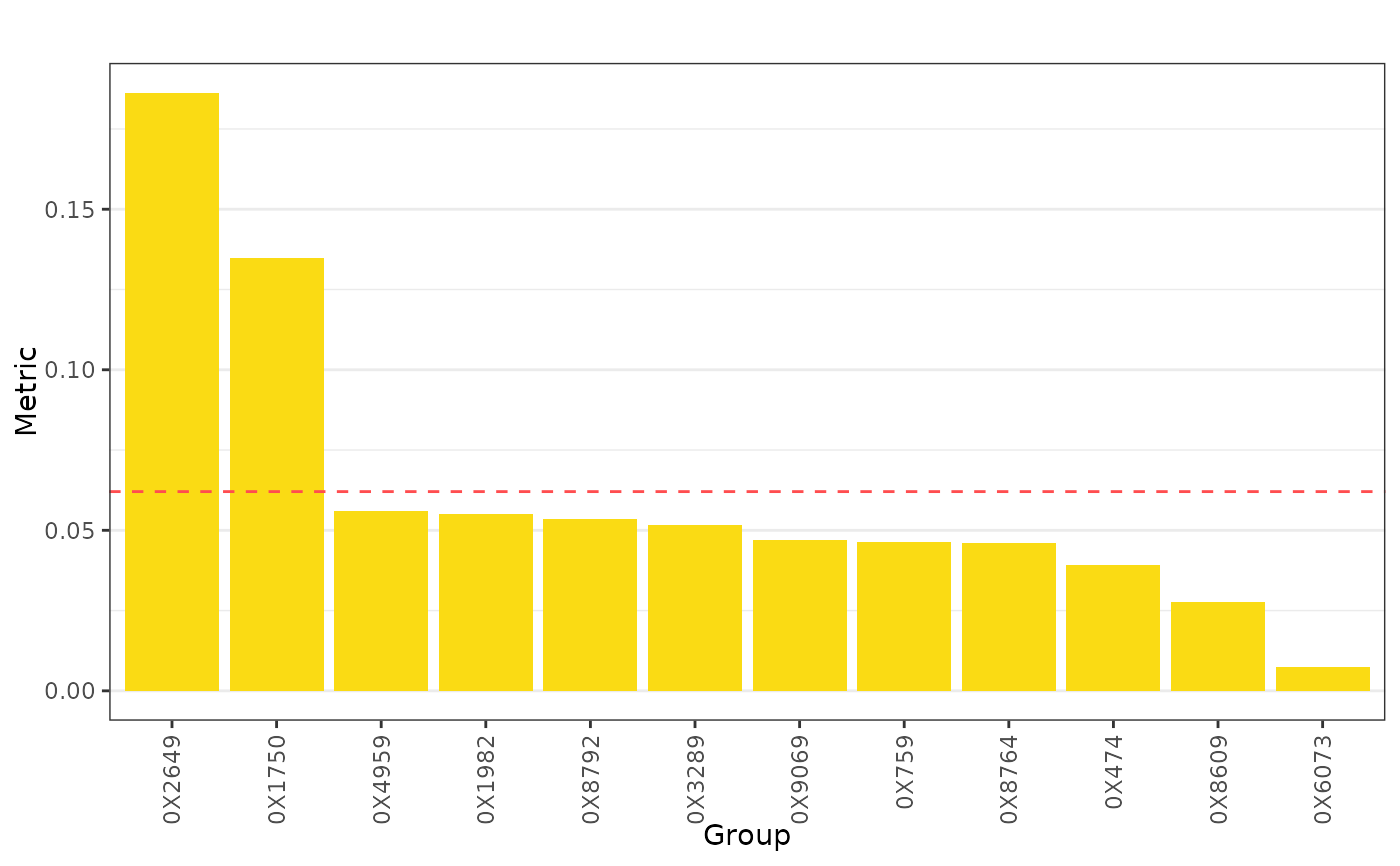
 ## Only show Flagged Groups
Visualize_Score(
dfResults = reportingResults_filter,
bFlagFilter = TRUE
)
## Only show Flagged Groups
Visualize_Score(
dfResults = reportingResults_filter,
bFlagFilter = TRUE
)
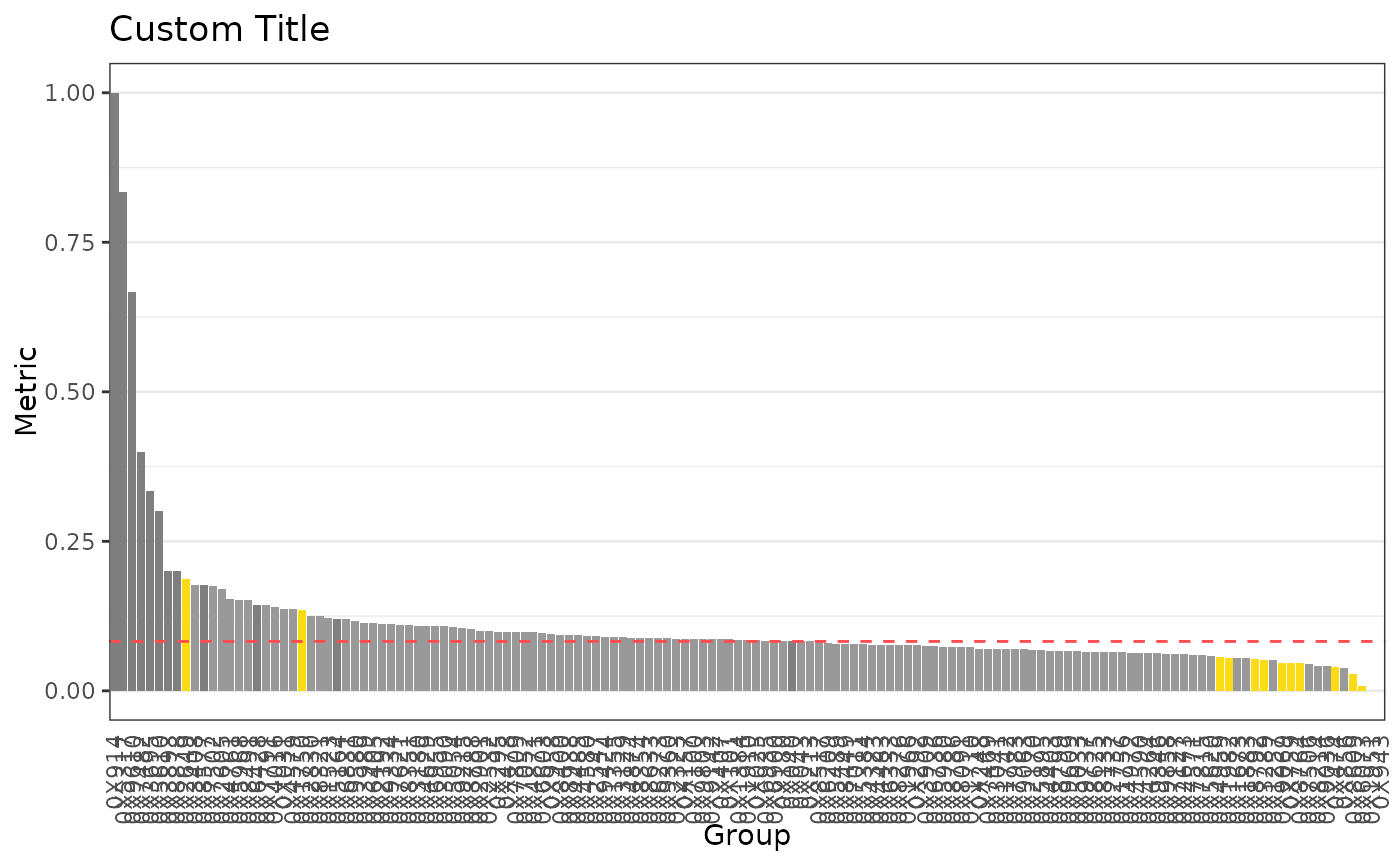
 ## Custom Title
Visualize_Score(
dfResults = reportingResults_filter,
strTitle = "Custom Title"
)
## Custom Title
Visualize_Score(
dfResults = reportingResults_filter,
strTitle = "Custom Title"
)